
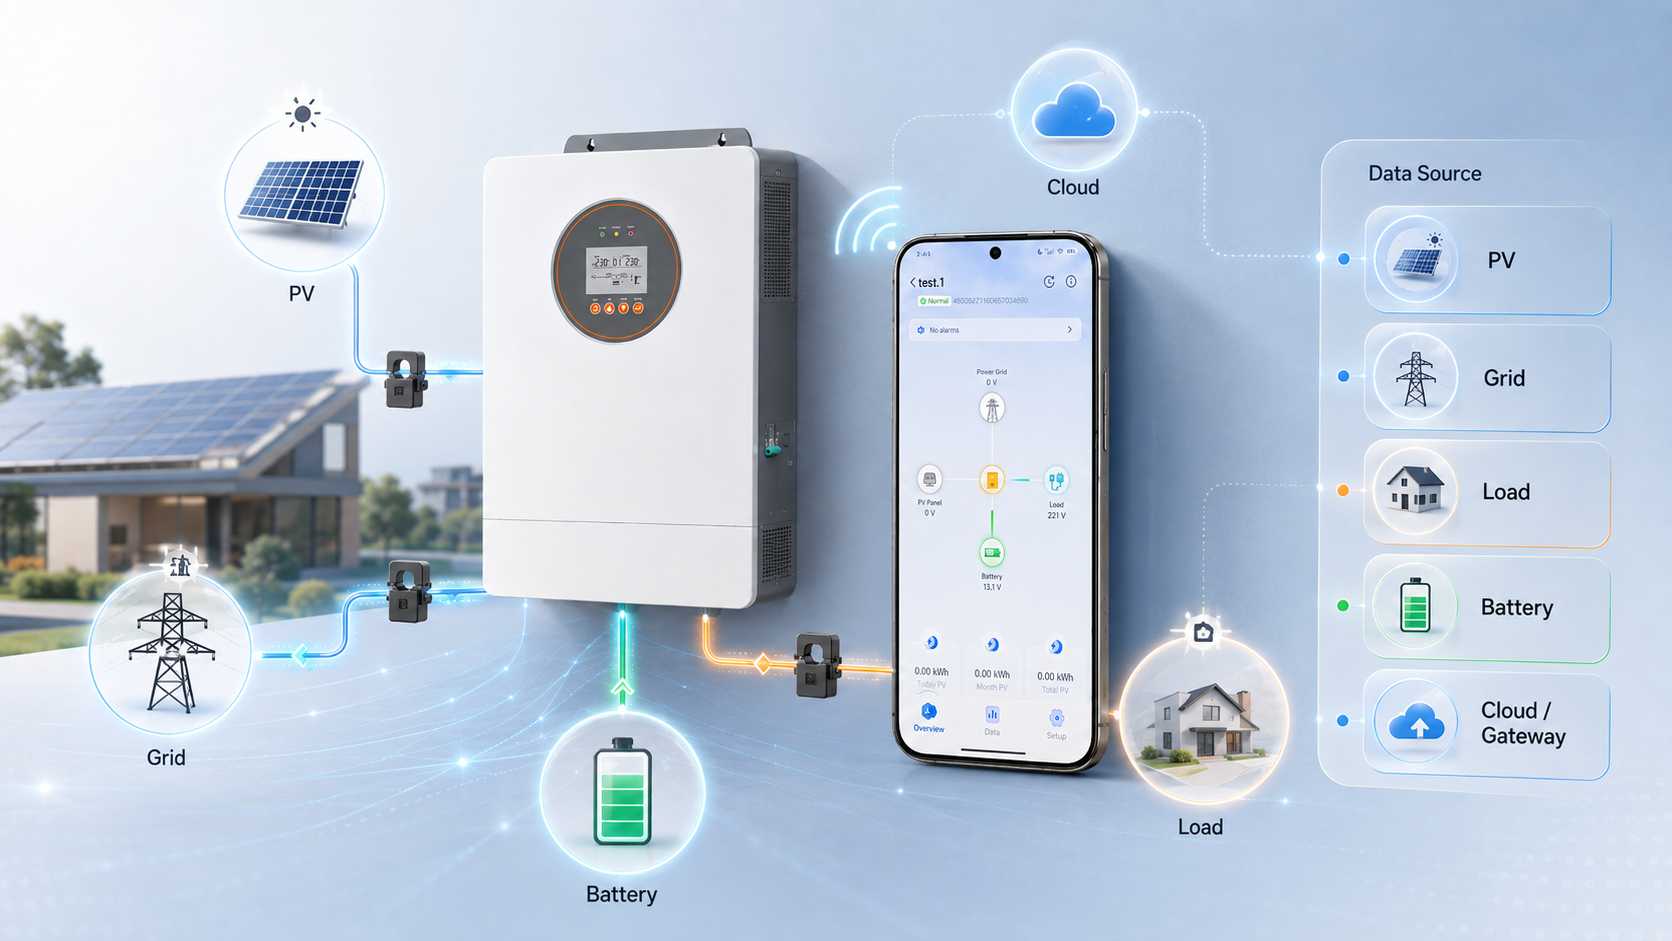
A monitoring app can show a healthy looking graph while leaving the most important buyer question unanswered: what physical device produced each value? Production may come from the inverter. Site consumption may come from a separate meter. Grid import and export may depend on current transformers. Battery information may arrive through a battery management system. Communication status can come from a gateway or cloud service. Treating those signals as one complete picture creates avoidable service calls and can also hide a real installation problem.
We use monitoring as an operating routine, not as a decorative dashboard. The routine starts with a data map, moves through a comparable baseline, and ends with a defined response for each alert. That sequence helps an owner distinguish weather effects from measurement errors, missing communication from equipment faults, and an app issue from a safety event that needs qualified service.
Start With the Measurement Boundary
The first commissioning question is not whether the app works. It is whether the app sees the equipment and meters needed for the decisions the owner expects to make. An inverter can report its own output without knowing the total building load. A battery inverter may show state of charge while grid flow remains unknown. A portal can also receive delayed records after a network interruption, so a blank interval does not automatically mean the photovoltaic system stopped producing.
Instantaneous power and accumulated energy require different interpretations. Power is a momentary operating value. Energy is accumulated over a stated period. Comparing a midday power reading with yesterday total energy creates a false alarm before the equipment is even checked. The dashboard label, unit, sampling interval and time period should therefore be part of the data map.
Buyer question | Data source normally required | What the reading cannot prove alone |
How much is the array producing now? | Inverter or production meter | Whether total site demand is rising or falling |
How much energy did the site use? | Site meter with correct placement and scaling | Whether every load was supplied by solar energy |
Is power moving to or from the grid? | Grid meter or current transformers | Whether the direction is correct without commissioning checks |
Is the battery available? | Battery management communication and inverter settings | Whether every battery value is compatible and correctly mapped |
Why is the app missing data? | Gateway, network, account, clock and cloud records | Whether the inverter stopped operating during the gap |
Meter location and direction matter as much as meter presence. A reversed current transformer can make import look like export. A meter placed on only part of a distribution board can make consumption appear lower than the actual site load. Incorrect scaling can produce numbers that look consistent but remain wrong. Commissioning should compare the portal with inverter values, meter direction, known loads and utility readings where available.
Build a Baseline That Can Explain Change
A single low day is weak evidence. Cloud cover, seasonal sun angle, temperature, shading, curtailment, cleaning condition and site load can all change the graph. A useful baseline compares matched periods and records enough context to explain the difference. The comparison can use the same hour on similar days, the same month across years, or measured output against a design estimate that reflects local conditions.
Start with complete intervals. Confirm the portal clock and time zone, then check whether data arrived late. Compare energy with energy, not energy with instantaneous power. Record major changes such as a new router, firmware work, meter replacement, battery setting change or unusual shading. These notes prevent the next technician from treating a known configuration event as a new fault.
The DOE performance assessment compared measured production from federal photovoltaic systems with coincident solar resource, temperature and modeled output. That method illustrates why interval alignment matters. A fair comparison needs measurements from the same period and a model or historical reference that reflects the conditions present during that period.
For a home or small commercial site, the baseline does not need to become a research project. Save a normal daily graph, a normal monthly total and the expected seasonal pattern. Note the system configuration and any recurring shade. When an alert appears, the owner can compare like with like before requesting service. The installer then receives dates, values and screenshots instead of a general report that solar output seems low.
Route Every Alert to the Right Response
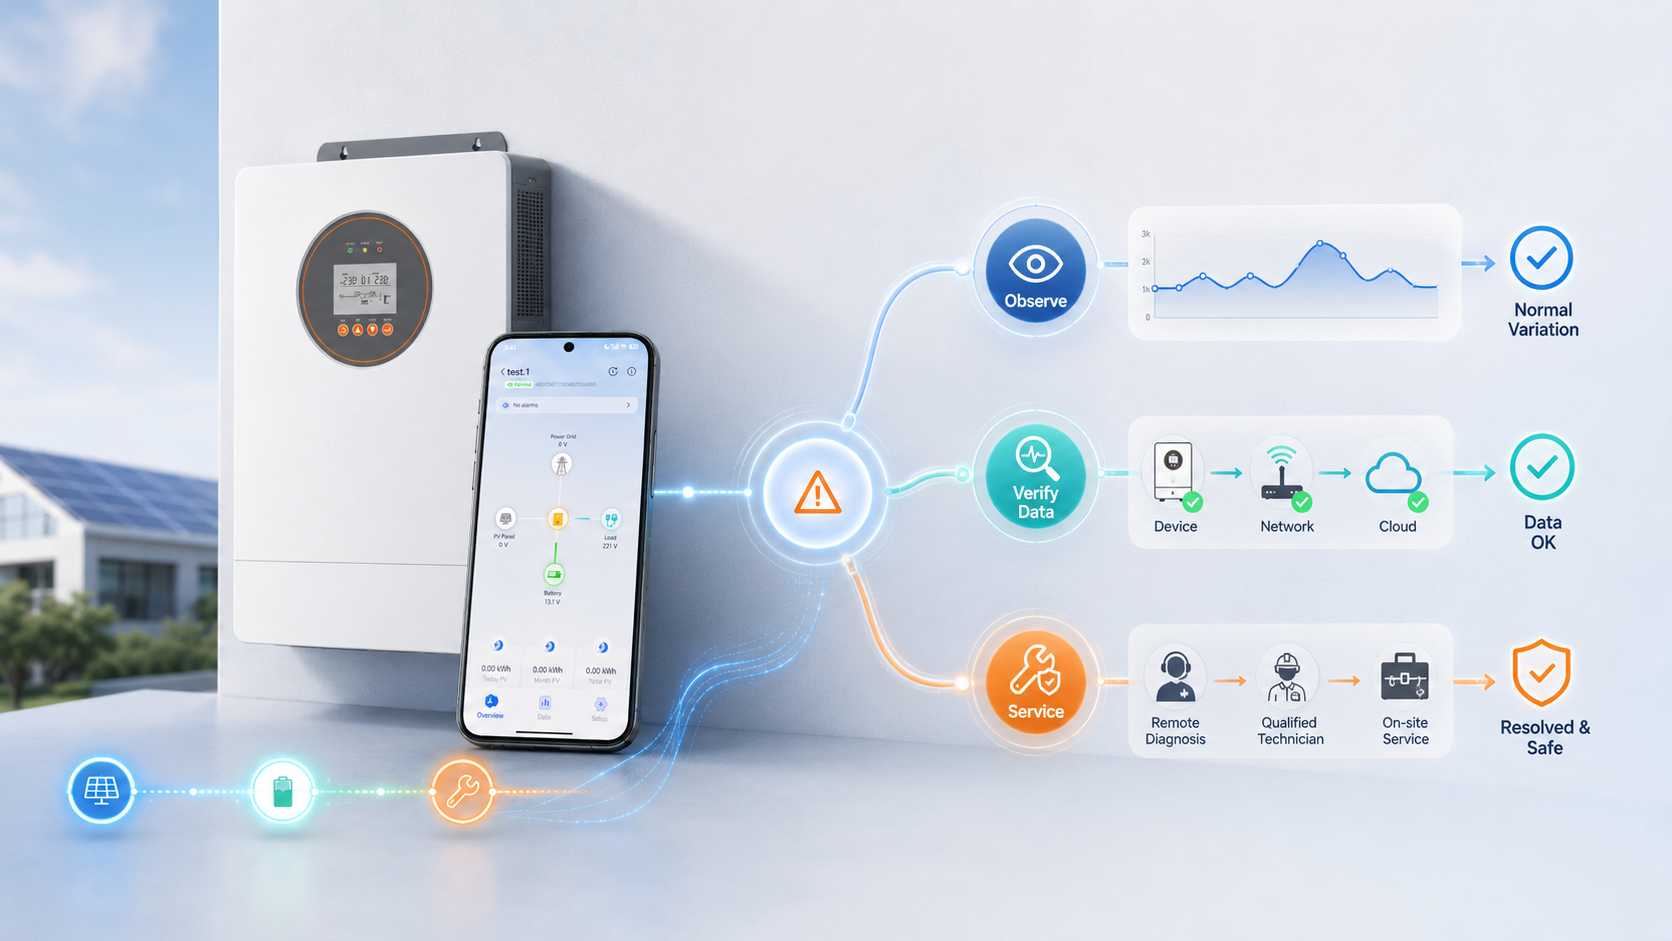
An alert should lead to one of three paths. The path depends on what the data can prove and whether there is any equipment or safety sign at the site. This division avoids two opposite mistakes: ignoring a fault because the app still opens, or repeatedly restarting equipment because the cloud portal is temporarily unavailable.
Observe Normal Variation
Short changes that match weather, shade, battery dispatch or a known operating schedule usually belong in observation. Confirm that energy continues to accumulate and that the pattern returns when conditions change. Keep a note if the variation repeats at the same time each day. A stable repeated pattern can help identify shading or programmed behavior without treating it as an equipment failure.
Verify the Data Chain
A blank portal, delayed graph or implausible flow direction belongs in data verification. Check the portal time, account access, gateway status and local network change. Compare the app with the inverter display if that can be done without opening energized equipment. Confirm whether delayed records appear later. For flow errors, ask the installer to verify meter placement, transformer direction, phase mapping and scaling.
Escalate Equipment or Safety Events
Persistent inverter faults, repeated protective trips, abnormal heat, odor, exposed wiring or a safety alert require qualified service. The owner should preserve the fault code, time, operating state and recent changes, then follow the approved shutdown or isolation procedure for the site. Repeated restarts can erase useful evidence and may expose the owner to energized parts.
Response path | Typical observation | Safe owner action | Escalation point |
Observe | Output follows cloud, shade or schedule | Compare a matched period and record context | Pattern remains unexplained or worsens |
Verify data | Portal is blank, delayed or shows impossible flow | Check account, clock, gateway and network status | Meter setup or communication cannot be confirmed |
Request service | Fault repeats or there is heat, odor, damage or a safety warning | Record the code and keep clear of energized equipment | Contact qualified service without repeated restart attempts |
Choose Monitoring Depth by Diagnostic Value
System level monitoring can confirm total production and broad operating status with relatively low complexity. String level monitoring can narrow a loss to part of an array when the electrical design supports that visibility. Panel level monitoring can help locate module specific issues, but it adds hardware, communication points and records that someone must maintain.
Select depth according to the cost of an unresolved fault and the service model. A compact residential array with simple access may not justify panel detail. A commercial roof with several orientations, difficult access or separate maintenance responsibilities may benefit from more granular evidence. The procurement question is therefore not which portal has the most charts. It is which measurement level reduces diagnosis time enough to justify its hardware and operating burden.
Alert design deserves the same discipline. Too many thresholds create noise, and noisy alerts are eventually ignored. Define who receives each alert, what evidence should be collected, how long observation is acceptable and who has authority to request service. An alert without an owner and an escalation rule is only another notification.
Keep Data Trustworthy Through the System Life
Monitoring accuracy can change even when the array does not. Router replacements can disconnect a gateway. Firmware work can alter communication behavior. Meter replacement can change scaling or direction. Account transfer can remove access to historical records. Battery replacement can introduce a new communication requirement. These are ordinary lifecycle events, so the operating file should record them.
The terminology, equipment and methods used for photovoltaic performance monitoring are covered by IEC 61724 Part 1. Project requirements should identify which measurements matter, their expected accuracy and how records will be retained. The standard provides a useful technical reference, while the final monitoring plan still needs to match the size, risk and service arrangements of the actual site.
The DOE operation and maintenance guidance also discusses retaining production records across hourly, daily, monthly and annual periods and maintaining meter and sensor accuracy. The practical lesson is simple: trend history only helps when the timestamps, devices and measurement settings remain traceable.
Schedule a record check after network work, inverter service, meter changes and account transfer. Confirm that new data appears, historical data remains available and expected units have not changed. Where exported files support service analysis, store them with the site record using dates and device identifiers that a technician can understand later.
Plan ES IP54 Monitoring During Procurement
Our ES IP54 On Off Grid Solar Inverter EURO range includes 6.2KW and 12KW versions with optional WiFi remote monitoring, USB and RS485 communication, battery communication capability and local LCD operating and fault information. Those interfaces provide building blocks for monitoring.
Product configuration information is available on the ES IP54 On Off Grid Solar Inverter EURO. Optional WiFi does not by itself create a complete production, consumption and grid flow dashboard. Consumption and grid values depend on supported metering, correct placement and correct commissioning. Battery values depend on compatible battery management communication and project settings. We confirm these boundaries before promising a monitoring view so that the handover matches the installed measurement chain.
Before ordering, state whether the owner needs production only, site consumption, grid direction, battery status, remote fault records or exported history. Confirm the communication route, account owner, network responsibility and local display procedure. This turns optional connectivity into a serviceable operating feature.
Complete the Monitoring Handover
The monitoring handover should give the owner enough information to interpret normal operation and enough evidence to request useful support. Include these eight items in the project record.
1. A data map linking each dashboard value to its inverter, meter, transformer, battery system, gateway or cloud source.
2. A device list with model, identifier, location, communication method and the party responsible for network access.
3. Account permissions, recovery details and a documented process for ownership transfer without losing history.
4. Screenshots of normal production, consumption, grid flow, battery status and communication status where those values are installed.
5. A baseline report with dates, weather context, expected seasonal pattern and any known shading or operating schedule.
6. Alert definitions with the responsible recipient, observation period, evidence required and service escalation contact.
7. Data retention, export and offline behavior, including whether delayed records can upload after communication returns.
8. The qualified personnel boundary for opening equipment, changing protection settings, checking wiring or responding to heat, odor and damage.
Ask the installer to demonstrate the handover while the system is operating. A saved password and a portal link are not enough. The owner should be able to identify the source of a reading, recognize a normal comparison period, record an alert and know when to stop checking and call qualified service.
Conclusion
A solar monitor system becomes operationally useful when its measurement boundary is documented, its baseline uses comparable periods and every alert has a defined response. Buyers should verify which device supplies production, consumption, grid and battery values before treating the dashboard as a complete site view. Monitoring depth should reflect the cost of diagnosis, not the number of charts available.
✉️Email: marketing@snadi.com.cn
Website:
☎️WhatsApp / WeChat: +86 1803929353

FAQ
Not always. Inverter production can be available while site consumption and grid flow remain unknown. Those values normally require compatible metering or current transformers installed and configured for the site.
Does a blank app mean the solar system stopped generating?
Why can grid import and export appear reversed?
How long should an owner observe low production before calling service?
Is panel level monitoring necessary for every project?
What monitoring information should be confirmed for an ES IP54 inverter project?