

Yes, photovoltaic modules can generate electricity when clouds cover the sky because diffuse daylight can still reach the cells. Yet the question does solar panels work on cloudy days hides four different buyer questions. A system can show power now, collect less energy today, fail to restore a battery across several low resource days and still deliver acceptable annual value.
That is why one cloudy day percentage rarely helps a purchase or service decision. First choose the clock, then choose the metric and evidence.
Clock | Real buyer question | Metric | Best evidence | Decision |
Seconds to minutes | Is the inverter producing now | W or kW | Synchronized inverter power and irradiance | Observe ramps and operating state |
One daylight period | Did the array deliver useful energy today | kWh | Daily energy ledger and hourly weather model | Compare production with load timing |
Consecutive cloudy days | Can storage support critical loads | Usable kWh and unmet load | Battery state, load ledger and weather sequence | Resize reserve or change load priorities |
Month to year | Is the investment still worthwhile | Annual kWh and financial value | Historic weather, tariff and documented model | Approve, revise or reject the proposal |
The same solar panels in cloudy weather can pass one clock and fail another. A small reading at noon proves that the array is active. It does not prove that evening loads will be covered or that a battery will return to its target state of charge.
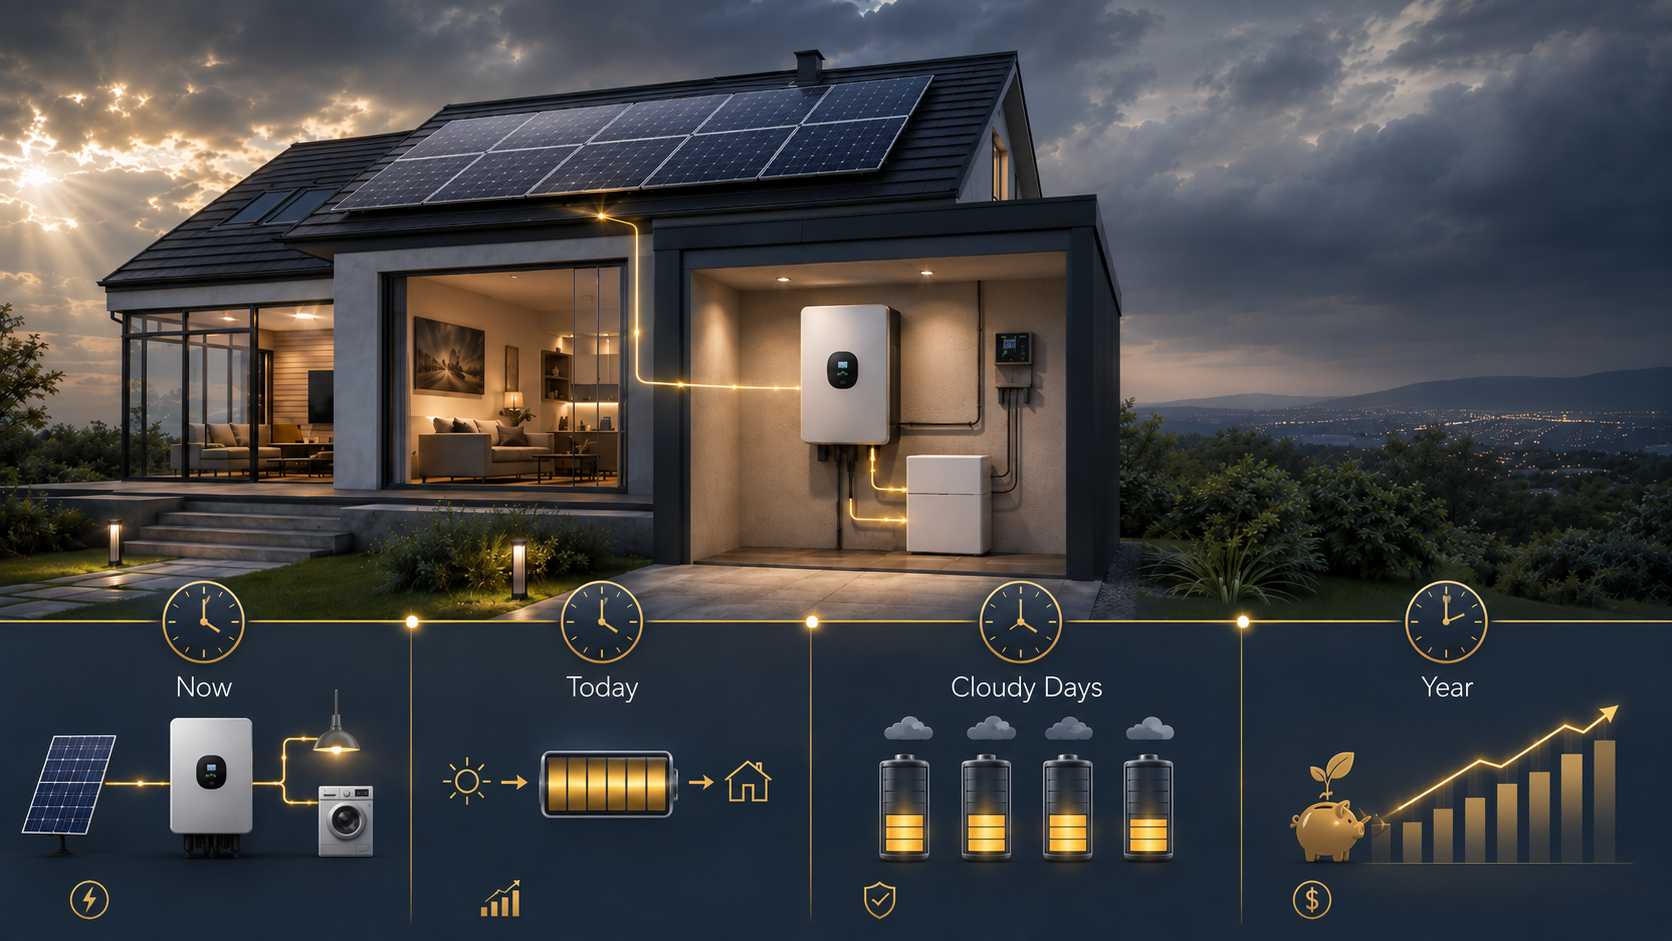
Clock One: Is the Inverter Making Power Now
Clouds Change the Light Mixture
A module receives more than a single direct beam. Sandia describes plane of array irradiance as the sum of beam, sky diffuse and ground reflected components. Cloud cover can reduce the direct component while diffuse light remains available across the sky. Array orientation, shading and ground reflectivity also change what reaches the module surface.
This explains why solar power in overcast weather is usually lower but not automatically zero. It also explains why a visual shadow test is weak evidence. Two skies that look equally grey can deliver different plane of array irradiance.
Low Irradiance Changes Direct Current Input
Module current responds strongly to irradiance. Under low light, the array may still have voltage while available current and power fall. The inverter then has less direct current power to convert. Startup conditions, MPPT range, part load behavior and grid state determine whether the app shows stable output, intermittent output or zero.
This is the practical basis of solar inverter low light operation. The module, string and inverter have to be assessed as one electrical path rather than as separate marketing specifications. For a real design, compare cold string voltage, hot operating voltage, string current and total array power with the exact inverter data sheet.
Fast Clouds Create Ramps
Broken cloud can produce rapid rises and falls. A short peak may result from changing cloud edges and irradiance, while a dip may last only one logging interval. Neither event represents daily energy by itself.
Victron Energy uses changing cloudy weather as an example of when rapid MPPT tracking matters. The broader buyer lesson is to examine interval behavior and the selected equipment rather than repeat one low light marketing claim.
Set every monitoring export to the same time zone and interval before comparing weather, inverter power and meter data. A five minute offset can make a normal cloud ramp look like a system response error.
Clock Two: Did the Array Deliver Useful Energy Today
Instantaneous power uses W or kW. Energy accumulated over time uses kWh. A 2 kW reading held for three hours contributes 6 kWh before system losses. A brief 4 kW peak may contribute less energy than a steady 1 kW period that lasts most of the day.
Energy path | Question | Evidence needed | Financial effect |
Direct solar use | How much load was served while PV was available | PV and load data on the same interval | Avoided grid purchase |
Battery charging | How much energy entered storage | Battery power and state change | Evening reserve value |
Grid export | How much surplus left the site | Export meter data | Export credit if applicable |
Grid import | How much energy was purchased | Import meter data | Operating cost |
Unserved or deferred load | Which loads could not run as planned | Load schedule and outage record | Production or comfort risk |
Cloudy day solar production should be compared with a documented expectation for the same site and period, not with array nameplate capacity. PVWatts V8 is the current National Laboratory of the Rockies API version and uses updated 2020 typical meteorological year data from the National Solar Radiation Database for covered locations. A useful model records location, module capacity, tilt, azimuth, losses, weather source and model version. Its annual and hourly outputs can support a proposal review, but actual weather, shading, soiling, curtailment and equipment availability still affect measured energy.
Clock Three: Can a Solar Battery Cover Consecutive Cloudy Days
Build the Critical Load Ledger
Start with devices that must remain available. Record watts, operating hours and duty cycle. A refrigerator, communications equipment, lighting and a small pump have different start behavior and daily energy needs. Move optional heating, cooling or process loads into a separate deferrable list.
Critical load | Running power | Daily use | Daily energy | Priority |
Refrigeration example | 180 W | 10 h equivalent | 1.8 kWh | First |
Communications example | 40 W | 12 h | 0.48 kWh | First |
Lighting example | 120 W | 5 h | 0.6 kWh | Second |
Pump example | 500 W | 1 h | 0.5 kWh | Second |
These values are illustrative. The buyer must replace them with measured or manufacturer supported load data.
Convert Nameplate Capacity Into Usable Reserve
Battery nameplate energy is not identical to energy available at the load. Reserve state of charge, allowed operating window, inverter conversion losses, battery management limits and temperature all reduce practical delivery.
A planning equation is: usable load energy equals battery nameplate energy multiplied by the allowed operating fraction and the assumed conversion factor. If a 10 kWh battery is planned around an 80 percent operating fraction and a 90 percent conversion factor, the illustrative usable result is 7.2 kWh. Divide that by measured critical load energy, then test whether cloudy PV can restore any reserve during the day.
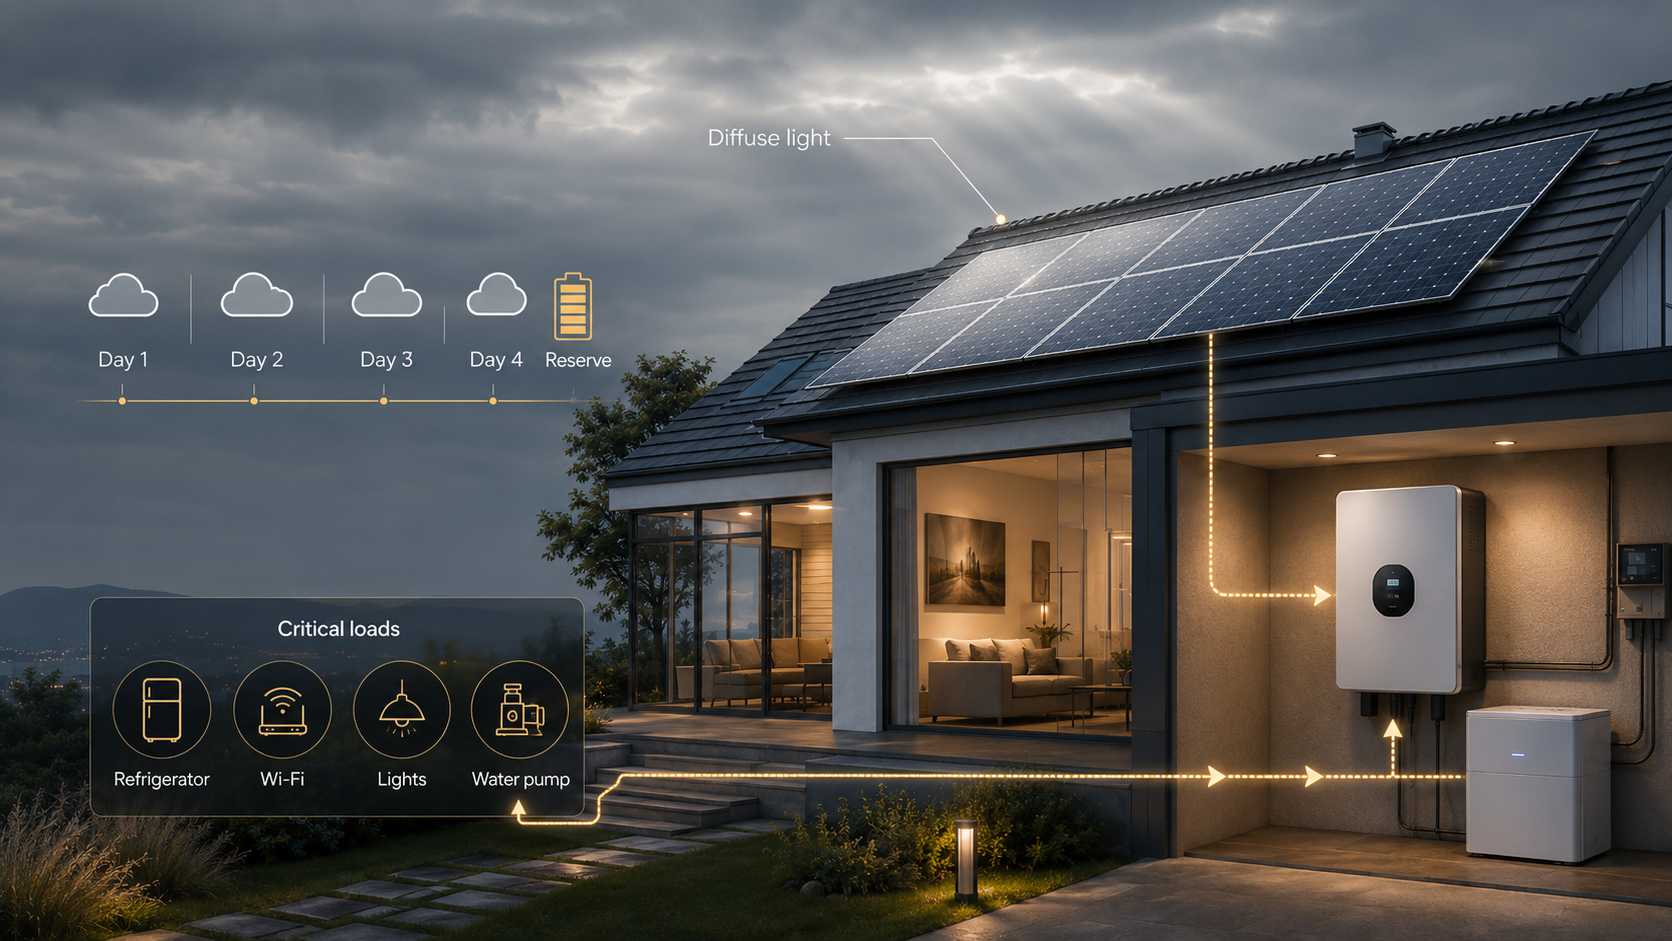
Test a Weather Sequence
A solar battery on cloudy days must be tested across a sequence, not an average. Record starting state of charge, daily PV input, critical load energy, reserve floor and the next morning state. A grid connected backup system may accept grid charging. An off grid system needs a larger energy margin, tighter load control or another supported charging source.
Design option | CAPEX tendency | OPEX tendency | Operating risk | Best fit |
Grid connected PV without battery | Lower | Depends on import tariff | No backup during an outage | Annual bill reduction |
PV with battery reserve | Higher | Can shift some purchased energy | Reserve can fall after repeated cloudy days | Evening loads and outage support |
PV with battery and generator input | Highest among these options | Fuel and maintenance remain | More charging paths but more system complexity | Longer resilience objective |
When we review a battery backed proposal, the SNADI/SNAT Solar GS Hybrid Solar Inverter IP65 can be considered where a 6.5 kW hybrid inverter, 48 V battery interface and generator input fit the load plan. Its published photovoltaic limits include 9 kW maximum allowable string power, 500 V maximum direct current voltage and an 80 to 450 V MPPT range. The array still needs model specific voltage and current calculations for local temperatures and module data. WiFi and RS485 can support the synchronized evidence workflow described later.
Clock Four: Is Solar Worth It in a Cloudy Climate
Cloudy climate solar economics depend on annual modeled production, tariff structure, self consumption, export value, financing, maintenance and avoided interruption cost. The darkest afternoon of the year cannot answer that question.
Two sites with the same annual solar resource can produce different financial results. One may use most solar energy during business hours and avoid a high retail tariff. Another may export much of its production at a low credit. Storage can increase self consumption or resilience, but it also adds capital cost, conversion loss and replacement planning.
1. The weather file and model version.
2. Array tilt, azimuth, capacity and stated losses.
3. Hourly load assumptions and tariff inputs.
4. Direct use, export, import and battery flow results.
5. A sensitivity case for lower production or higher load.
6. Warranty, monitoring and service responsibilities.
Solar panel low light performance belongs inside this annual model. It should not be treated as a stand alone slogan that guarantees payback.
Label Every Cloudy Day Percentage
A statement about cloudy output needs at least five fields: location or weather dataset, cloud or weather classification, measurement interval, comparison baseline and data source.
Measured claims also need system capacity, array orientation, inverter state and timestamp. Instead of saying panels produce a fixed percentage under clouds, write that a named system produced a measured amount during a defined interval compared with a stated baseline. Without those fields, the number is an example, not a design guarantee.
Run a Safe 24 Hour Evidence Protocol
Synchronize the Records
Confirm time zone, logger interval and missing data. Export inverter power, daily energy, battery state and grid status where available. Record weather conditions for matching timestamps.
Capture System State
Note cloud state, rain, visible shade, soiling clues, battery state, grid availability, alarms and curtailment notices. Owners should not climb onto a wet roof, open energized equipment or disconnect photovoltaic wiring.
Compare the Same Metric
Compare kW with kW and kWh with kWh. Use the same interval and a weather adjusted expectation. Repeat the comparison across multiple similar periods before declaring a fault. IEC 61724 Part 1 provides terminology, equipment guidance and methods for photovoltaic performance monitoring and analysis.
Know When Cloudy Weather Is Not the Whole Diagnosis
Normal weather response usually follows available daylight and recovers when conditions improve. Investigation becomes more reasonable when one string or MPPT behaves differently, output remains at zero during adequate daylight, timestamps disappear, alarms appear or weather adjusted underperformance persists.
Symptom | Possible weather signature | Other possibility | Safe next step |
Smooth power reduction across the array | Dense cloud across the site | Normal operation | Keep synchronized records |
Fast repeated ramps | Broken cloud movement | Monitoring interval artifact | Compare weather and power timestamps |
One MPPT differs from another | Uneven cloud or shade can contribute | String, connector or module issue | Provide channel data to a technician |
Zero output with adequate daylight | Low irradiance may delay operation | Grid state, settings, wiring or equipment fault | Record codes and request qualified service |
Battery does not recharge | PV energy below load | Charge settings or battery limit | Review the complete energy ledger |
Buyers should check the manual for allowed user actions. Electrical measurements on hazardous circuits belong to qualified technicians.
Conclusion
The answer to does solar panels work on cloudy days is yes, but a useful purchase decision needs four clocks. Check inverter power by minute, usable energy by day, battery reserve across a weather sequence and financial value across the year.
For buyers, request an hourly model, a load ledger, a documented storage sequence and an inverter compatibility check instead of a universal cloudy percentage. For owners, save synchronized monitoring and weather records before deciding that low output is a fault. That evidence turns a vague cloudy weather concern into a clear system decision.
✉️Email: marketing@snadi.com.cn
Website:
☎️WhatsApp / WeChat: +86 1803929353

FAQ
They can generate when usable diffuse daylight reaches the cells. Output can be much lower than under clear conditions, so measure energy and inverter state rather than relying on appearance.
What Percentage of Normal Output Should I Expect?
Can Solar Panels Charge a Battery on Cloudy Days?
Why Does the Inverter Show Zero During Daylight?
What Data Should I Save Before Calling a Technician?
How Do I Judge Solar Value in a Cloudy Climate?