

A manufacturing plant outside Monterrey or a food packaging facility in the São Paulo interior contends with tough day to day operating conditions: regional peak tariff spikes, unpredictable grid voltage fluctuations, and rooftop ambient temperatures regularly exceeding 45°C. When plant operators and engineering procurement managers allocate substantial capital to photovoltaic arrays, they anticipate clear reductions on their monthly utility invoices.
Even so, many commercial arrays fall short of modelled financial projections by 4% to 8%. During performance audits, service technicians frequently verify module strings and clean soiling, only to identify the actual loss factor right on the plant wall: real world power inverter conversion running well below the 98.5% peak metric advertised in product literature.
Across commercial and industrial sites, conversion loss converts generated kilowatt hours straight into waste heat. Recognizing how efficiency responds across varying voltage ranges, operational load steps, and ambient heat levels determines whether a distributed generation asset yields reliable returns or turns into an ongoing financial drag.
What Inverter Efficiency Means and Why Nameplate Peak Ratings Mislead
At its core, solar inverter efficiency indicates how effectively a power conversion unit transforms direct current from solar strings or battery banks into clean, synchronized alternating current suitable for industrial equipment and facility loads.
The underlying relation is straightforward:
Efficiency (%) = (PAC Output / PDC Input) × 100
When a commercial rooftop array delivers 50 kW DC into the inverter terminals and the hardware outputs 48.5 kW AC to the main distribution switchboard, 1.5 kW dissipates as heat.
(48.5 kW / 50.0 kW) × 100 = 97.0%
That 1.5 kW deficit must be evacuated from the housing through internal heatsinks and forced ventilation channels to prevent thermal stress on sensitive electronics.
CEC Efficiency Versus European Efficiency
To gauge high efficiency inverter units reliably, design engineers look to weighted efficiency equations rather than single peak numbers. The two primary benchmark standards globally are European Efficiency and California Energy Commission (CEC) Efficiency.
Both methodologies compute a weighted profile by applying percentage factors to measured efficiency across distinct loading levels (ranging from 10% through 100% of nominal rating):
European Efficiency: ηEuro = 0.03 η5% + 0.06 η10% + 0.13 η20% + 0.10 η30% + 0.48 η50% + 0.20 η100%
CEC Efficiency: ηCEC = 0.04 η10% + 0.05 η20% + 0.12 η30% + 0.21 η50% + 0.53 η75% + 0.05 η100%
The functional weighting between these methodologies is substantial. The European standard weights heavily toward moderate and lower loading bands: 48% of the score sits at the half load point, with another 32% assigned across loads at or below 30%. This structure mirrors Central and Northern European climates marked by frequent overcast periods, diffuse light, and lower insolation.
Meanwhile, the CEC testing protocol developed under California Energy Commission Testing Guidelines places 74% of the calculation weight on mid to high loads (21% at half load and 53% at three quarter load).
For projects located throughout Latin America, whether across the Atacama Desert in Chile, northern Mexico industrial corridors, or the Brazilian interior, solar arrays run the bulk of daytime hours under intense sunshine. Consequently, the CEC rating provides a far more realistic indicator of expected field generation than European efficiency figures. Specifying power hardware based solely on European standards risks choosing equipment that runs suboptimally under sustained high loads.
Five Root Causes of Conversion Losses in Field Deployments
When a commercial system exhibits persistent solar inverter losses, the root cause rarely traces back to manufacturing defects. In practice, performance dips originate from five predictable physical and electrical mechanisms:
· Operating Outside the Nominal MPPT Voltage Band:
Every maximum power point tracker operates within an optimal DC voltage window. In a typical three phase 400V inverter, the internal DC bus operates around 580V to 620V. If string sizing produces summer operating voltages around 310V, the internal boost converter must continuously step up that potential. This continuous switching increases thermal stress across internal IGBTs or silicon carbide MOSFETs, cutting conversion efficiency by 1.5% to 2.5%.
· Thermal Derating in Elevated Ambient Temperatures:
Power conversion components are sensitive to thermal buildup. As junction temperatures climb, internal semiconductor resistance rises. When ambient air in unconditioned inverter bays tops 40°C, the unit triggers automated thermal derating to protect critical switches. Rather than converting full available array output, the inverter throttles DC input, drifting off the optimal curve. In field conditions, this cuts generation by 10% to 30% right during peak production windows.
· Low Load Losses During Shoulder Hours:
During morning ramp up, evening tail off, or facility equipment pauses, inverters often run below 15% of rated capacity. Fixed consumption from control boards, sensors, and communication units remains constant regardless of active output, pulling low load conversion efficiency below 90%.
· Standby Tare Consumption in System Topologies:
Transformerless designs yield higher operating efficiency (typically 97% to 99%) than legacy transformer isolated units (92% to 95%). However, baseline parasitic consumption overnight or during synchronization can continuously pull 20W to 80W. On compact commercial sites, this steady idle consumption noticeably erodes net annual production.
· Multiple Conversion Steps in Energy Storage:
Deploying hybrid architectures introduces several conversion transitions: array DC to storage voltage, battery DC to AC machinery loads, and AC to DC battery charging during off peak tariffs. Each stage introduces switching and conduction losses. Low voltage 48V battery systems require heavy current flow and thick conductors, resulting in considerably higher I²R resistive losses than high voltage storage topologies running between 300V and 600V.
PRACTICAL SIZING ADVICE:
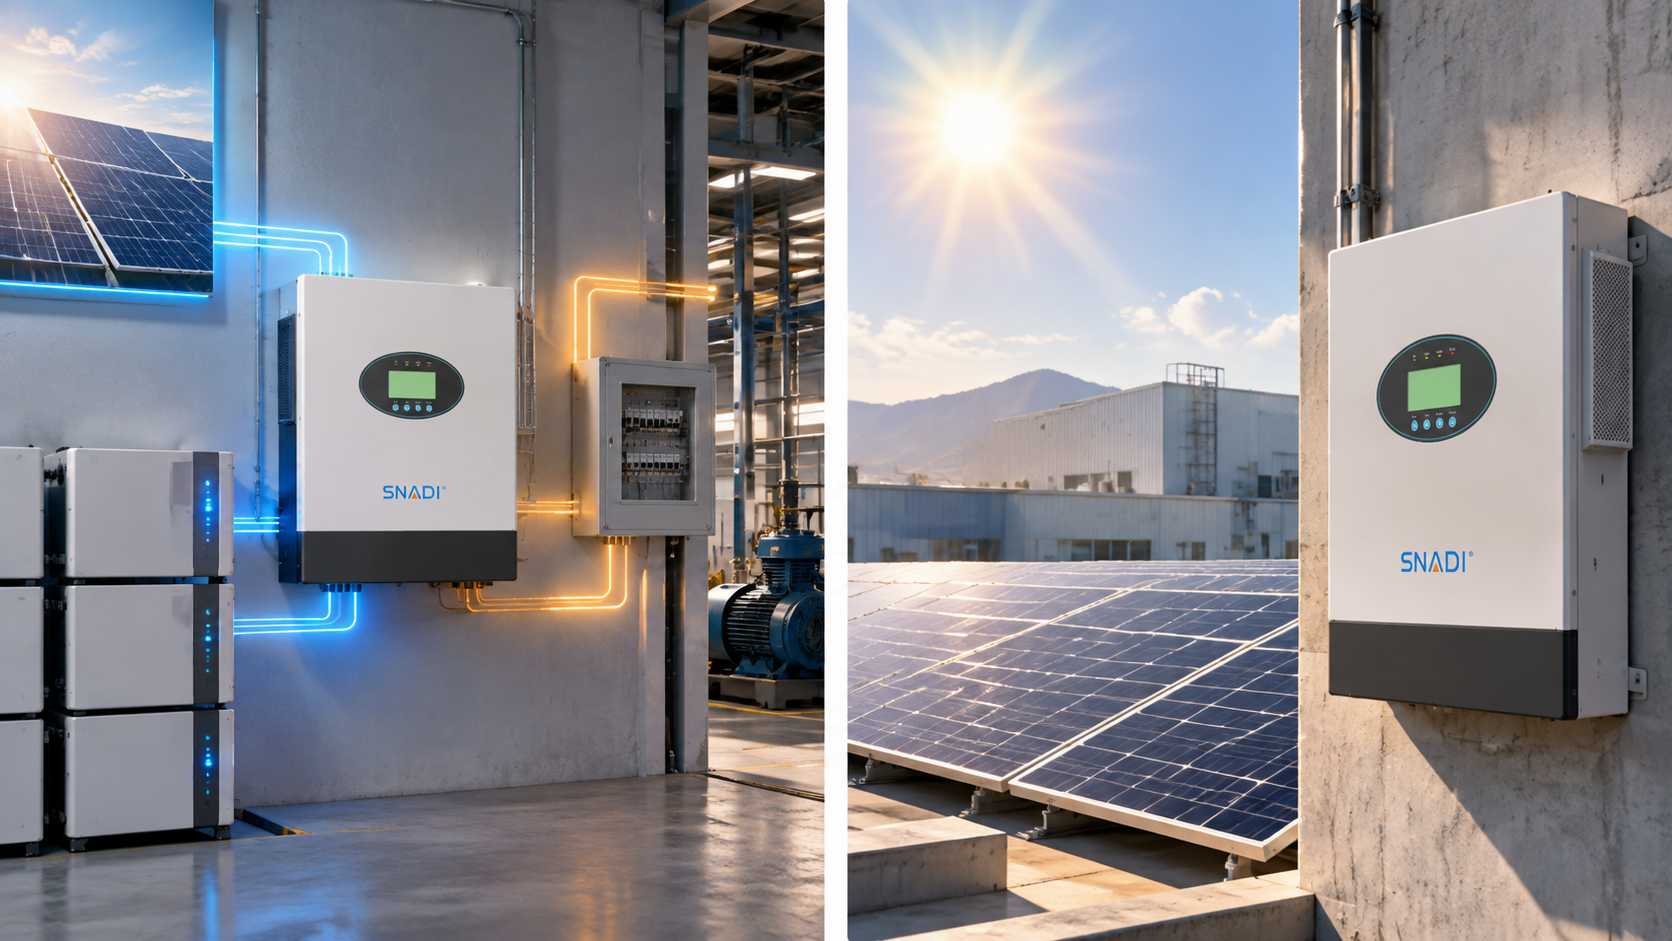
When engineering string layouts for warm climates, evaluate module voltage at maximum power using 65°C cell temperature rather than 25°C factory metrics. If high summer temperatures push string voltage to the bottom boundary of the tracker window, the internal boost stage runs under continuous thermal stress. Sizing strings so standard operating voltage sits close to the inverter nominal DC input prevents early derating and fan wear.
Financial Impact: How a 2.5% Conversion Gap Changes Commercial Returns
To understand why power conversion performance impacts project economics, evaluate a representative commercial facility: a cold storage hub running a steady 100 kW load.
Commercial Tariffs in Mexico (CFE Tarifa GDMTH)
In Mexico, midsize and large enterprises fall under the Gran Demanda en Media Tensión Horaria (GDMTH) tariff system managed by the Comisión Federal de Electricidad (CFE). Under GDMTH, commercial electricity bills account for base, intermediate, and peak consumption, alongside monthly capacity demand charges.
Across central and northern states, peak rates regularly exceed 4.80 MXN (roughly $0.26 USD) per kWh, with peak demand fees adding substantial expense. Evaluating an array producing 160,000 kWh annually highlights the practical cost difference between a 97.5% efficient commercial inverter and an economy unit operating at 95.0%:
Performance Metric | Value |
97.5% High Efficiency Hardware Yield | 156,000 kWh usable AC electricity |
95.0% Standard Hardware Yield | 152,000 kWh usable AC electricity |
Annual Generation Shortfall | 4,000 kWh lost annually |
At a weighted commercial rate of 3.80 MXN ($0.21 USD) per kWh, this 2.5% gap represents $840 USD in lost annual value. Over a 10 year period, excluding utility inflation, this single performance difference adds up to $8,400 USD in forfeited savings, a figure that frequently outstrips the initial purchase price of the conversion equipment.
Brazil Regulatory Framework Under Lei 14.300
In Brazil, commercial facilities operate under the regulatory terms established by Lei 14.300/2022 and monitored by the Agência Nacional de Energia Elétrica (ANEEL). As distribution wire tariffs (Fio B) phase into grid injection calculations, behind the meter self consumption yields the strongest financial return.
Every kilowatt hour lost in conversion cannot displace incoming utility purchases or requires settlement under lower value injection credits. For Grupo A commercial clients managing contracted demand (demanda contratada), mid afternoon inverter derating forces sudden grid power draws. Exceeding contracted limits triggers severe utility penalty rates.
Architecture Comparison and Mitigation Approaches
Selecting commercial hardware requires balancing upfront capital expense with long term conversion performance and site durability. The table below details common architectures deployed across Latin American commercial facilities:
Architecture | Field Efficiency | Relative CAPEX | Derating Temp | Primary Operational Fit |
Standard String Inverter (Transformerless) | 97.0% to 98.2% | Low | 45°C to 50°C | Commercial rooftops with uniform orientation and clear sun exposure |
High Frequency Hybrid (Low Voltage 48V) | 93.0% to 95.5% | Moderate | 40°C to 45°C | Workshops requiring cost effective essential battery backup |
High Voltage Commercial Hybrid | 96.5% to 97.8% | Moderate to High | 45°C to 50°C | Peak shaving and demand charge management for commercial operations |
Transformer Isolated Low Frequency Unit | 90.0% to 93.5% | High | 50°C and above | Industrial sites handling heavy inductive motor surges and unstable lines |
Selecting Equipment for Demanding Commercial Environments
Balancing conversion efficiency, thermal stability, and long-term operational reliability is essential when selecting inverter architecture for commercial projects exposed to unstable grids, high ambient temperatures, and variable load profiles.
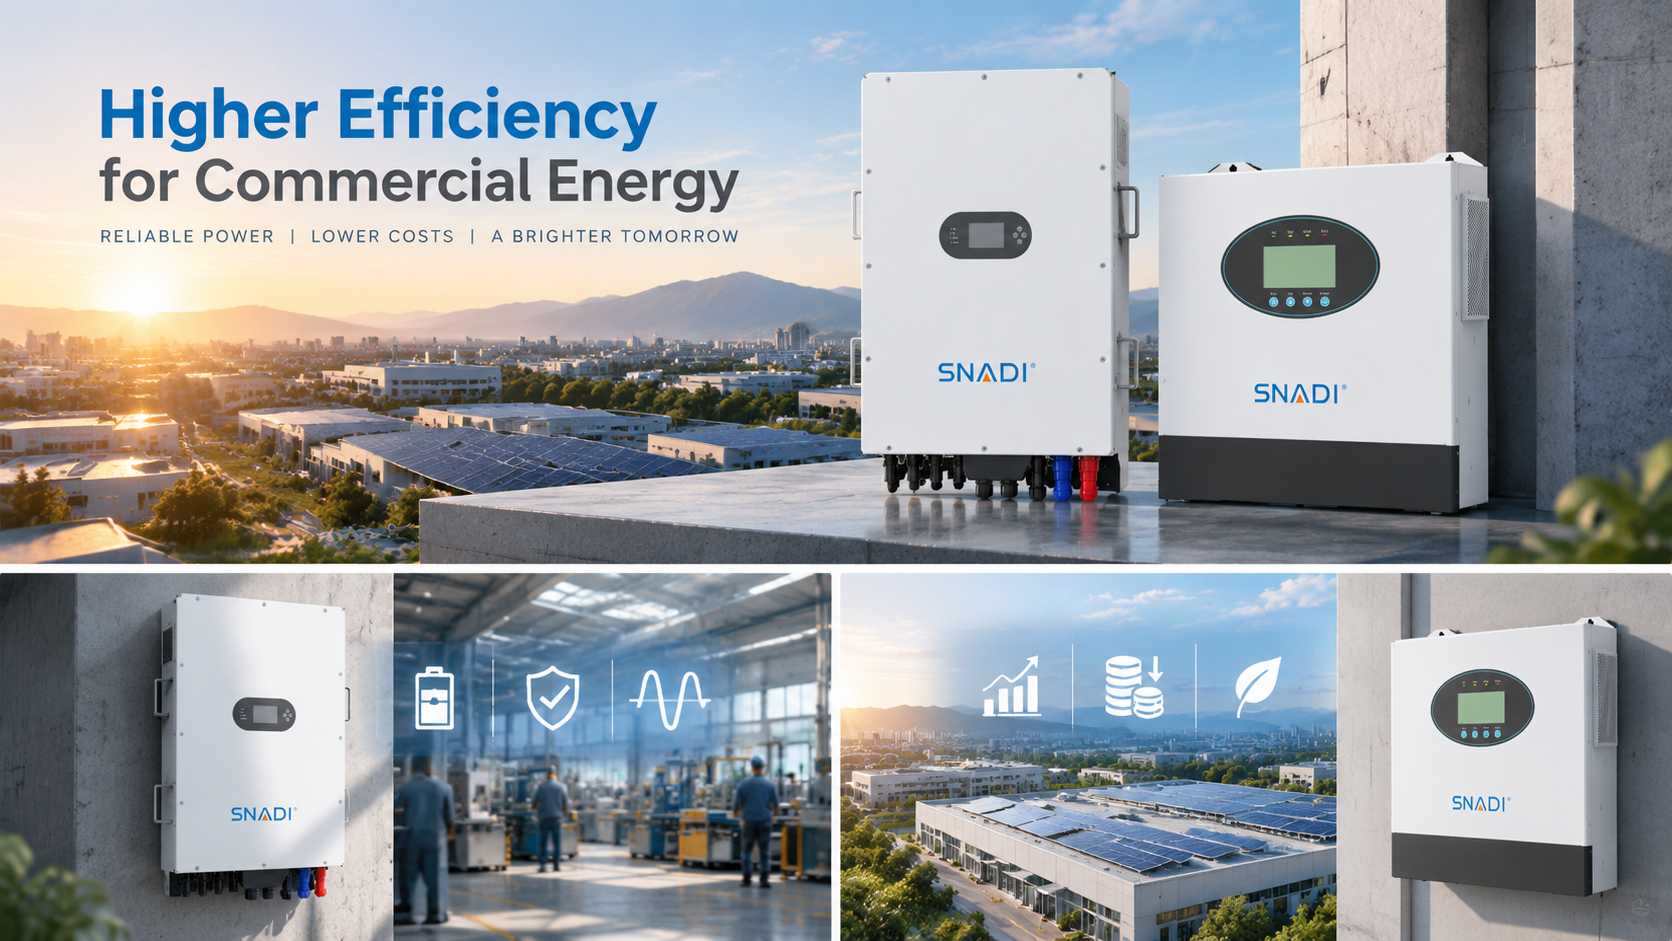
For commercial facilities requiring reliable backup power, clean electricity output, and flexible energy management, the SNAT NKH Off-grid Hybrid Solar Inverter provides a practical solution with integrated MPPT control, pure sine wave output, and intelligent protection functions. Its high-frequency conversion design helps improve system response during dynamic load changes while maintaining stable power delivery for shops, workshops, and small commercial facilities.
For larger commercial and industrial projects focused on peak shaving, demand charge management, and renewable energy integration, the SNAT GZB Three Phase Hybrid Solar Inverter is designed for high-voltage battery systems and complex energy applications. By supporting three-phase power management and high-voltage energy storage integration, the system reduces current-related losses, improves overall conversion performance, and helps protect long-term project returns under demanding operating conditions.
Procurement Verification Checklist for Field Installations
Before signing off on inverter procurement, engineering leads and technical teams can verify equipment suitability through these six checkpoints:
· Review the Complete Efficiency Profile: Examine the manufacturer efficiency curve across loading percentages. Verify that performance stays level between 30% and 80% capacity rather than peaking sharply and dropping off under heavy loads.
· Verify Temperature Derating Limits: Check factory thermal documentation. Industrial hardware should sustain full output up to 45°C or 50°C, whereas entry level models often begin throttling at 35°C to 40°C.
· Check String Voltages at Summer Temperatures: Calculate array voltage at maximum power using expected local heat extremes. Confirm that strings remain safely within the optimal tracker window during midday heat, while staying below maximum limits in winter cold.
· Evaluate Enclosure and Cooling Architecture: In dusty or arid environments such as northern Mexico or coastal South America, verify whether the system employs sealed thermal channels or standard external fans. Particulate accumulation on internal components degrades heat dissipation and triggers premature thermal throttling.
· Verify Standby Power Consumption: In storage paired setups, confirm idle energy draw when solar generation is offline. Continuous standby power above 50W drains storage capacity without delivering productive output.
· Confirm Power Quality and Harmonic Distortion: Verify that total harmonic distortion remains under 3%. Non linear factory machinery such as CNC equipment, motor drives, and pumps run warmer and less efficiently when supplied with distorted AC power.
Conclusion
In commercial distributed generation, investment returns depend on fine margins. While solar modules receive significant attention, power inverters represent the critical link determining how much generated energy reaches facility distribution gear.
Looking beyond laboratory peak figures, weighting efficiency against actual regional climates, and matching string voltages to tracker operating sweet spots prevents avoidable conversion losses from undermining project returns. In commercial energy markets across Latin America, equipment reliability and consistent conversion performance provide dependable protection against volatile operational electricity expenses.

FAQ
For transformerless string inverters, a CEC weighted rating of 97.0% or higher is solid, with premium units reaching 98.0% to 98.5%. For hybrid and energy storage equipment handling multiple conversion steps, round trip efficiency between 94.0% and 96.5% demonstrates strong field performance.
Is an inverter with a 98.5% peak rating inherently better than one rated at 97%?
How does conversion efficiency influence peak shaving returns?
What causes sudden efficiency drops in operating inverters?