

A solar inverter converts DC electricity from PV modules into AC electricity for site loads or the grid. Modern units can also manage MPPT, battery charging, grid synchronisation, monitoring, export control and protection. That wider role matters when AC output falls. A reduction may reflect an external command or operating rule rather than conversion loss.
An inverter efficiency curve describes AC output relative to DC input across operating conditions. System yield asks a wider question: how much useful AC energy was delivered over time after weather, shading, wiring, downtime, clipping, curtailment and thermal behaviour affected the system.
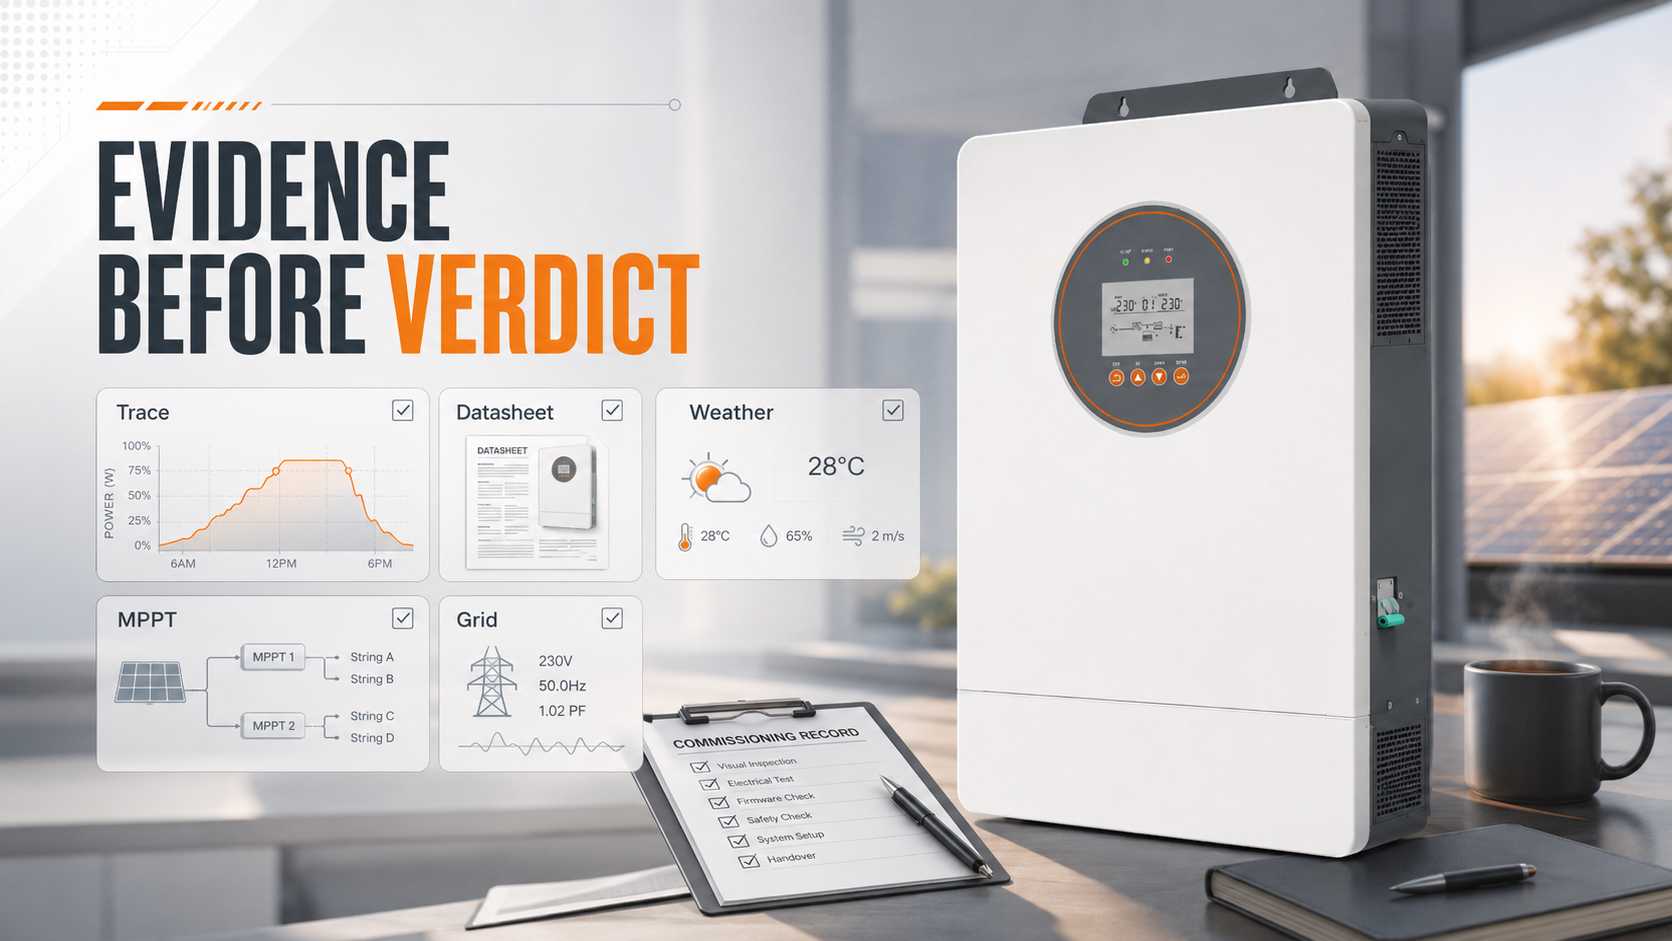
Before reading a graph, label the measurement boundary. Confirm whether the value is DC input, AC output or another meter reading. Check whether each point represents one minute, five minutes or one hour. Align timestamps with local time and weather records. Find out how missing data is represented, and whether grid commands, alarms and operating modes appear in the same export.
A mobile app is useful evidence, but it is not a complete diagnosis. A graph without the model, firmware, array layout, grid profile and weather context can support a question, not a final verdict.
· Identify the electrical boundary for every power and energy value.
· Align the trace with irradiance, temperature, operating mode and grid events.
· Preserve the original export before changing settings or clearing alarms.
· Ask a qualified installer or electrical professional to handle any live equipment review.
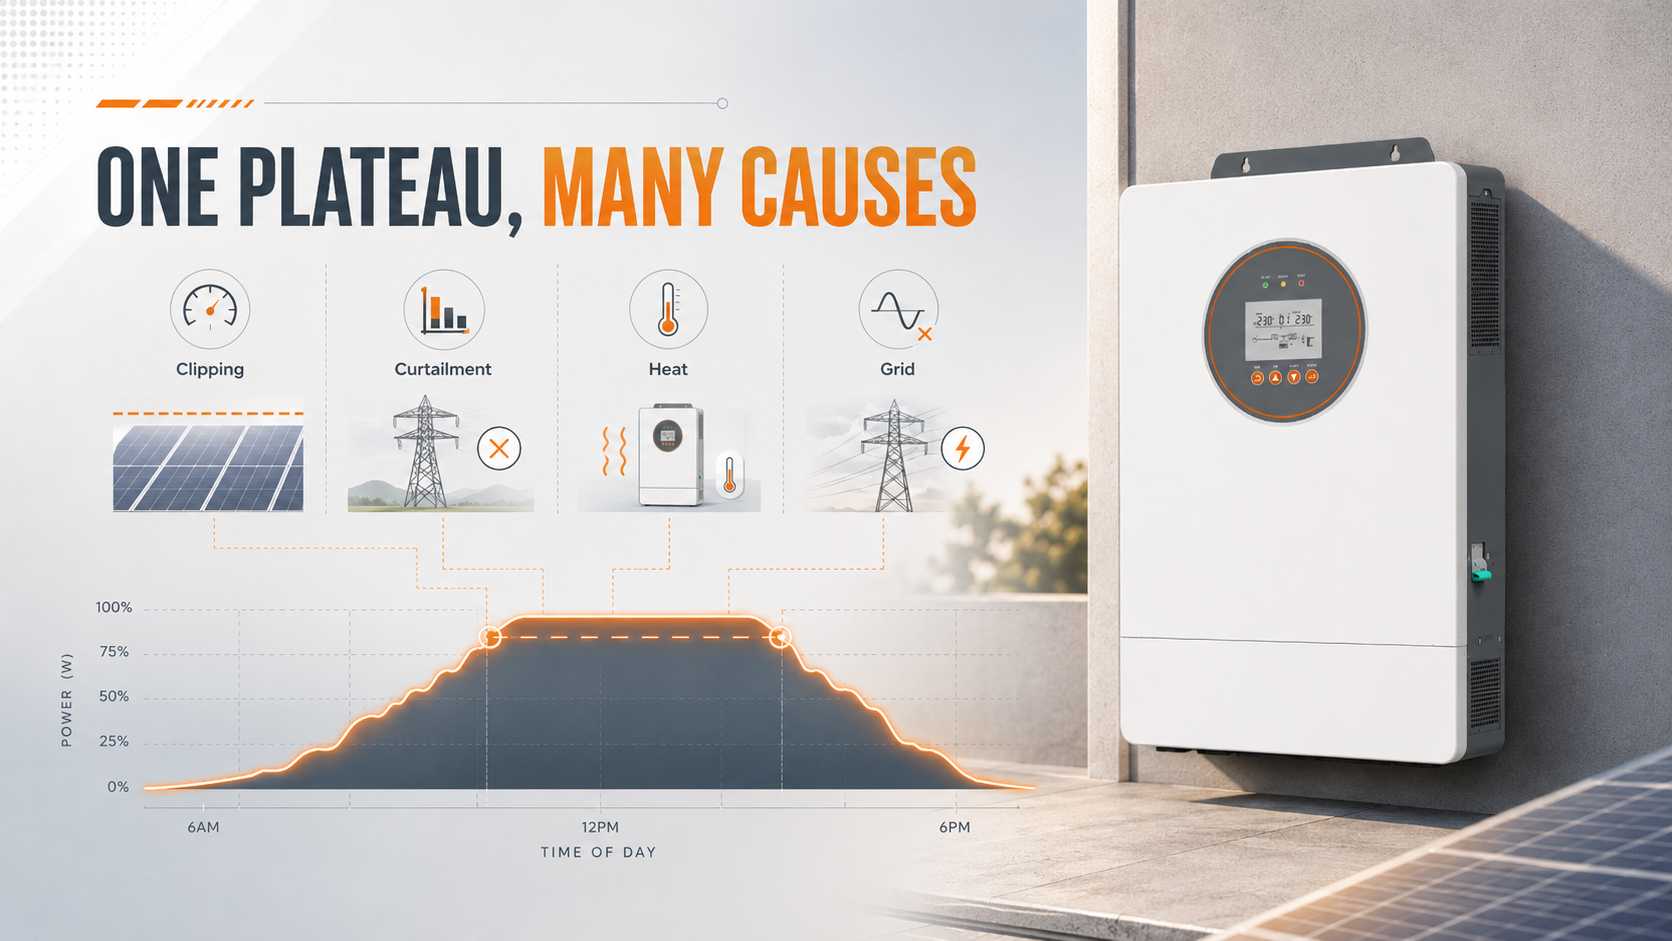
A Clean Repeatable Cap Near Rated AC Output
When clear days repeatedly reach the same AC ceiling near rated output, planned inverter clipping is a reasonable hypothesis. Check the approved energy model, inverter AC rating, array DC rating and DC to AC ratio. Compare the plateau timing with irradiance and module temperature.
Clipping can be deliberate. A larger array may improve morning, afternoon or low irradiance production even if some possible midday power cannot pass through the AC rating. The useful question is whether the annual energy and financial trade off were modelled and accepted, not whether any clipping occurs.
A Heat Linked Reduction or Cycling Pattern
If output falls as enclosure or ambient temperature rises and recovers after cooling, investigate thermal derating and installation conditions. Check shade, clearances, airflow, fan status, dust accumulation and the temperature curve in the model manual.
A Lopsided or Intermittent Trace
An uneven morning and afternoon shape can reflect orientation or shading, while intermittent gaps may point to MPPT restart, string imbalance, grid events, communications or a fault. Compare tracker level voltage and current where available. Check whether each string matches the approved schedule and whether shading changed after installation.
National Renewable Energy Laboratory research shows that inverter clipping can mask other performance effects, including soiling related loss. A flat top therefore cannot prove that modules, strings and measurements are healthy. Preserve DC and AC evidence before drawing a conclusion.
Observed shape | Evidence needed | Do not assume | Next safe action |
Repeatable rated output cap | DC rating, AC rating, weather and approved model | Every clipped interval is a defect | Compare actual timing with the design model |
Export aligned cap | Meter signal, export setting and grid event log | Low output means poor conversion | Verify the control sequence with the installer |
Heat linked reduction | Ambient temperature, internal temperature and airflow record | A hot enclosure has failed | Check installation conditions and model limits |
Intermittent or lopsided curve | Tracker data, string schedule, alarms and shading evidence | One weak string is the only cause | Preserve exports and arrange qualified inspection |
Compare Efficiency Metrics Without Confusing Yield
Peak efficiency is the highest reported conversion result under specified conditions. It does not show how often the inverter operates at that point. CEC efficiency and European weighted efficiency combine results from several loading points with different weightings. They are more representative than a single peak value for their intended test methods, but they still do not predict annual yield at every site.
IEC 61683 provides a procedure for measuring photovoltaic power conditioner efficiency. IEC TS 63156 extends power conversion equipment evaluation toward expected energy performance for a location and solar load profile. A comparable laboratory result and a site energy forecast answer different buyer questions.
Metric | What it helps answer | What it cannot answer |
Peak efficiency | Best measured conversion point under stated conditions | Annual energy, availability or thermal loss |
CEC efficiency | Weighted performance under the CEC method | Performance under a different weighting method |
European weighted efficiency | Weighted performance under a European reference profile | Yield for every climate, array or load |
Inverter efficiency curve | Behaviour across input power and voltage | Shading, downtime, curtailment and wiring loss by itself |
Compare two models only when the efficiency method, voltage condition, product class and test revision are comparable. If one quotation lists peak efficiency and another lists a weighted value, request matching evidence rather than ranking the percentages.
Read the Datasheet Fields That Change the Curve
The solar inverter datasheet should connect directly to array design and monitored behaviour. The following fields deserve a written check before a model is accepted.
Datasheet field | Design question | Visible operating effect |
Rated AC output | What continuous AC ceiling is approved? | Planned output plateau |
Maximum DC input | Can the proposed array stay within absolute limits? | Shutdown or equipment risk if exceeded |
DC to AC ratio | What array oversizing assumption supports the yield model? | Clipping frequency and partial load production |
MPPT voltage range | Will each string stay in the tracking window across temperature? | Tracker restart or reduced harvest |
Maximum input current | Can modules and parallel strings stay within the current limit? | Current limiting or design rejection |
Number of trackers | Can different orientations or shading zones be separated? | Mismatch visibility and production |
Temperature derating | What output is available at the installation temperature? | Heat linked power reduction |
Grid profile and monitoring | Which commands, alarms and measurements are recorded? | Curtailment evidence and service speed |
Also request standby consumption, warranty terms, firmware policy, communication protocol and replacement planning. A high efficiency value has limited procurement value if the monitoring export is inaccessible or the selected product cannot support the required grid profile.
SNADI/SNAT Solar Engineer tip:
Ask the designer to mark expected operating voltage and current for each string at hot and cold conditions on the inverter limits. A module wattage total alone cannot prove MPPT compatibility.
Review Product Fit After the Evidence Packet
After the evidence packet is ready, the SNADI/SNAT Solar ES IP54 On/Off Grid Solar Inverter EURO can be reviewed for residential and small commercial hybrid applications that need an IP54 enclosure, battery free operation and remote monitoring. Includes 6.2 kW and 12 kW models, 90 V to 450 V MPPT range plus USB, RS485 and optional WiFi or GPRS communication.
Those values do not select the model by themselves. We still ask for the module datasheet, string schedule, cold open circuit voltage, hot operating voltage, current calculation, load profile, battery plan, grid requirements and installation temperature.
For installation and maintenance, it calls for clear airflow, inspection of dust and debris, attention to exposed wiring and review of fault indications. An IP rating does not remove thermal or maintenance duties. Parallel models also need consistent settings, communication wiring and current sharing checks. We use those requirements to frame commissioning, not to promise that every site should use parallel operation.
We focus on residential, small commercial and C&I inverter, lithium battery and energy storage applications. Final selection depends on documented loads, array geometry, local grid rules and qualified electrical design.
Match the Topology to the Source of Mismatch
A string inverter combines modules into strings and provides a practical balance of service access, monitoring and cost for many unshaded roofs. A microinverter converts power at module level and can provide finer monitoring granularity, but it places more electronics on the roof. Module level electronics may help when shading or orientations differ, yet they add components and compatibility questions.
Architecture | Buyer advantage | Trade off to review | Best evidence |
Central inverter | Central service point for larger arrays | Larger consequence from one outage | Redundancy and service plan |
String inverter | Familiar design and accessible service | String mismatch can reduce grouped output | Tracker layout and string data |
String inverter with module electronics | More module level control or visibility | More roof components and compatibility checks | Approved pairing and monitoring map |
Microinverter | Module level conversion and monitoring | Distributed service work on the roof | Roof access and replacement process |
No topology wins every project. Choose according to shading pattern, roof access, electrical architecture, service capability, monitoring ownership and future expansion. Annual energy modelling should use the selected equipment and actual geometry.
Build a 30 Day Solar Inverter Monitoring Record
Capture Electrical Inputs and Outputs
Record daily AC energy, maximum AC power, DC voltage and current by MPPT where available. Keep the inverter model, firmware, settings backup and data ownership in the same project file. The record should show whether the observed output is measured at the inverter, a site meter or another boundary.
Align Weather and Control Evidence
Align the trace with irradiance, temperature, grid events, export commands and operating mode. Compare clear days with the approved model. Do not expect identical curves when weather and temperature change, but do investigate repeated differences that follow the same condition.
Preserve Alarms and Settings
Record alarm codes, communication gaps, firmware version, grid settings and any change made during the review. Note who receives alarms, who can change settings and how original evidence is preserved. A clean dashboard without an escalation owner is only a display.
Escalate Through a Qualified Professional
Do not reset alarms, change grid settings or disconnect strings simply to see what happens. Those actions can erase evidence, create safety risk or violate interconnection requirements. Send the evidence packet to the installer or O&M provider and request an incident record with the observation, data source, affected period, hypothesis, test and responsible professional.
1. Model datasheet revision and firmware record.
2. Array layout, string schedule and one line diagram.
3. Annual energy model with the DC to AC sizing assumption.
4. Commissioning plan, monitoring export and alarm log.
5. Local grid profile and export rule when the system connects to a utility.
Conclusion
The inverter should be selected and accepted through evidence, not one peak percentage. Start with the power trace, classify the shape, confirm the measurement boundary and connect each hypothesis to a datasheet field or operating record. That process separates conversion efficiency from clipping, grid control, heat and faults.
For a purchase or performance review, send the inverter model, firmware, datasheet revision, array layout, string schedule, one line diagram, DC to AC sizing assumption, commissioning record, monitoring export, alarm log and local grid profile. We can return a documented assumptions register and design evidence review without pretending that one dashboard curve provides an instant efficiency verdict.
✉️Email: marketing@snadi.com.cn
Website:
☎️WhatsApp / WeChat: +86 1803929353

FAQ
A solar inverter converts DC electricity from PV modules into AC electricity for site loads or the grid. Depending on the design, it may also manage MPPT, battery charging, grid synchronisation, monitoring, export control and protection. The required functions must be confirmed from the selected model and local grid rules.
Is 99 Percent Efficiency Always Better?
Is Clipping a Fault?
How Can I Separate Curtailment From Clipping?
When Does a Shaded Roof Need More MPPTs?
What Should a Buyer Check Before Choosing the Inverter?