

Business electricity rates may include time based charges, demand charges and changing use patterns. The value of solar depends on the rate structure and when the factory consumes electricity. A generic cost per panel cannot show whether output avoids a billed peak or is exported at a lower value.
Input | Why it matters | Internal owner | Common blind spot |
Monthly invoices | Shows energy, demand and charge structure | Finance | Missing tariff rider pages |
Interval demand data | Reveals timing and duration of peaks | Energy manager | Data timezone mismatch |
Production calendar | Connects load to shifts and shutdowns | Operations | Weekend or seasonal stoppage |
Roof drawings and age | Defines usable area and structural review | Facilities | Planned roof replacement |
Main single line diagram | Frames connection and protection scope | Electrical team | Outdated transformer rating |
Outage record | Supports a resilience value case | Operations | No cost assigned to restart loss |
Note roof age, structural reserve, membrane warranty, drainage, fire access, shading, exhaust equipment and maintenance routes. The usable plane is the area that can be built, inspected and repaired without creating a new operating problem. Keep planned roof replacement visible in the project schedule.
Build a Load Envelope From Operating Intervals
Separate Base, Production and Discretionary Loads
Annual kWh measures energy. It does not show the highest kW demand, how long that demand lasts or whether it overlaps solar production. Separate base loads such as servers, security and ventilation from production loads such as motors, compressors, refrigeration and machine tools. Mark discretionary loads such as charging, water heating or movable processes that can absorb midday PV.
Mark Peak Intervals and Tariff Windows
Identify the monthly peak interval, its duration and the equipment that causes it. Lawrence Berkeley National Laboratory explains that demand charges are based on maximum demand in kW and that solar demand savings vary with tariff design, the customer load and the PV generation profile. Solar alone can have limited demand reduction under some load shapes, especially when a peak is short or occurs outside solar hours.
Overlay Solar Production and Export Assumptions
Map expected PV production against facility load for each operating season. If midday output exceeds on site demand, record whether energy is exported, curtailed, stored or used by a process that can move in time. Do not assume exported energy has the same value as avoided grid energy.
Test Future Growth and Shift Changes
Add planned electric vehicles, new machines, cooling loads, extra shifts and efficiency projects. Keep current and future cases separate so finance can see the trade off. A design that only matches last year may be undersized for a planned line or oversized after a major efficiency upgrade.
Choose the Project Job Before Sizing Modules
Write the primary business job before sizing an industrial solar panel system. Solar can support several objectives, but one design cannot maximise every outcome at the same time. The financial value must follow the job. Energy offset is measured in avoided kWh. Demand management depends on kW and tariff windows. Resilience depends on interruption cost, load priority and required duration.
Primary objective | Evidence required | Solar only limit | When storage or controls enter |
Daytime energy offset | Hourly load and solar estimate | Surplus may be exported or curtailed | Shift flexible loads or store surplus |
Demand reduction | Peak timing and tariff method | PV may miss short or late peaks | Dispatch storage against measured peaks |
Outage resilience | Critical load kW and backup hours | PV normally cannot provide firm backup alone | Add storage, controls and isolation strategy |
Renewable energy target | Meter and reporting method | Production and consumption may not coincide | Add data ownership and reporting rules |
Future load capacity | Expansion schedule and service rating | PV does not increase every electrical limit | Review transformer, switchgear and storage |
Bring one recent bill, the tariff schedule and a production calendar to the first technical discussion. That evidence is more useful than an early price per watt.
Pick a Physical Plane Operations Can Maintain
Factory rooftop solar can shorten the route to the main electrical room, but it introduces structural reserve, membrane warranty, drainage, fire access, shading, roof age and maintenance questions. Ground mounting can simplify module access and avoid roof loading, but it may add land use, fencing, vegetation, drainage, trenching and a longer cable route. A carport can combine generation with covered parking, while also adding vehicle clearance, civil work, lighting and pedestrian movement requirements.
Site option | CAPEX tendency | OPEX focus | Operating risk | Strong fit condition |
Rooftop | Medium | Access, cleaning and roof coordination | Leak or structural conflict | Sound roof with daytime facility load |
Ground | Medium to high | Vegetation, fencing and inspection | Land and cable route constraints | Available controlled land |
Carport | Higher | Structure, drainage and vehicle area | Civil work and traffic interface | Parking value or charging plan |
Write the Electrical, Safety and Handover Scope First
An industrial solar installation needs a current single line diagram, service and transformer ratings, protection coordination, isolation points, grounding arrangement, monitoring communications and the utility connection route. Local electrical rules, fire requirements, insurer conditions and utility procedures remain controlling.
Commissioning and handover are design deliverables. IEC 62446 Part 1 defines customer handover information for a grid connected PV system and describes commissioning tests and inspection criteria. It can guide the document package, but it does not replace local law or prove that a particular design is accepted by a utility.
The bid should state who supplies the grid study, protection settings, meter changes, shutdown plan, witness tests and final drawings. If those responsibilities are missing, a low equipment price may simply move cost and schedule risk to the buyer.
Compare Bids as Operating Assets
Put every bidder on the same assumptions. Require the same weather data, load period, export value, degradation basis, availability assumption and tariff version. Mark absent evidence as not documented rather than guessing.
Bid line | Required evidence | Buyer check | Red flag |
Module supply | Exact model, electrical data and traceability | Match layout and string design | Family name only |
Energy model | Inputs, loss factors and hourly output | Compare with load and export | Annual yield without assumptions |
Structural scope | Method, loads and roof interfaces | Confirm warranty and access | Roof suitability assumed |
Grid scope | Connection study and protection duties | Assign each approval task | Utility work excluded without owner |
Monitoring | Account owner, export format and alerts | Ensure buyer keeps data access | Portal access ends with contractor |
O&M | Tasks, response time, spares and exclusions | Budget planned and corrective work | Maintenance described as negligible |
Handover | Drawings, tests, settings and training | Acceptance gate is written | Payment due before usable records |
Add Storage Only When the Data Gives It a Job
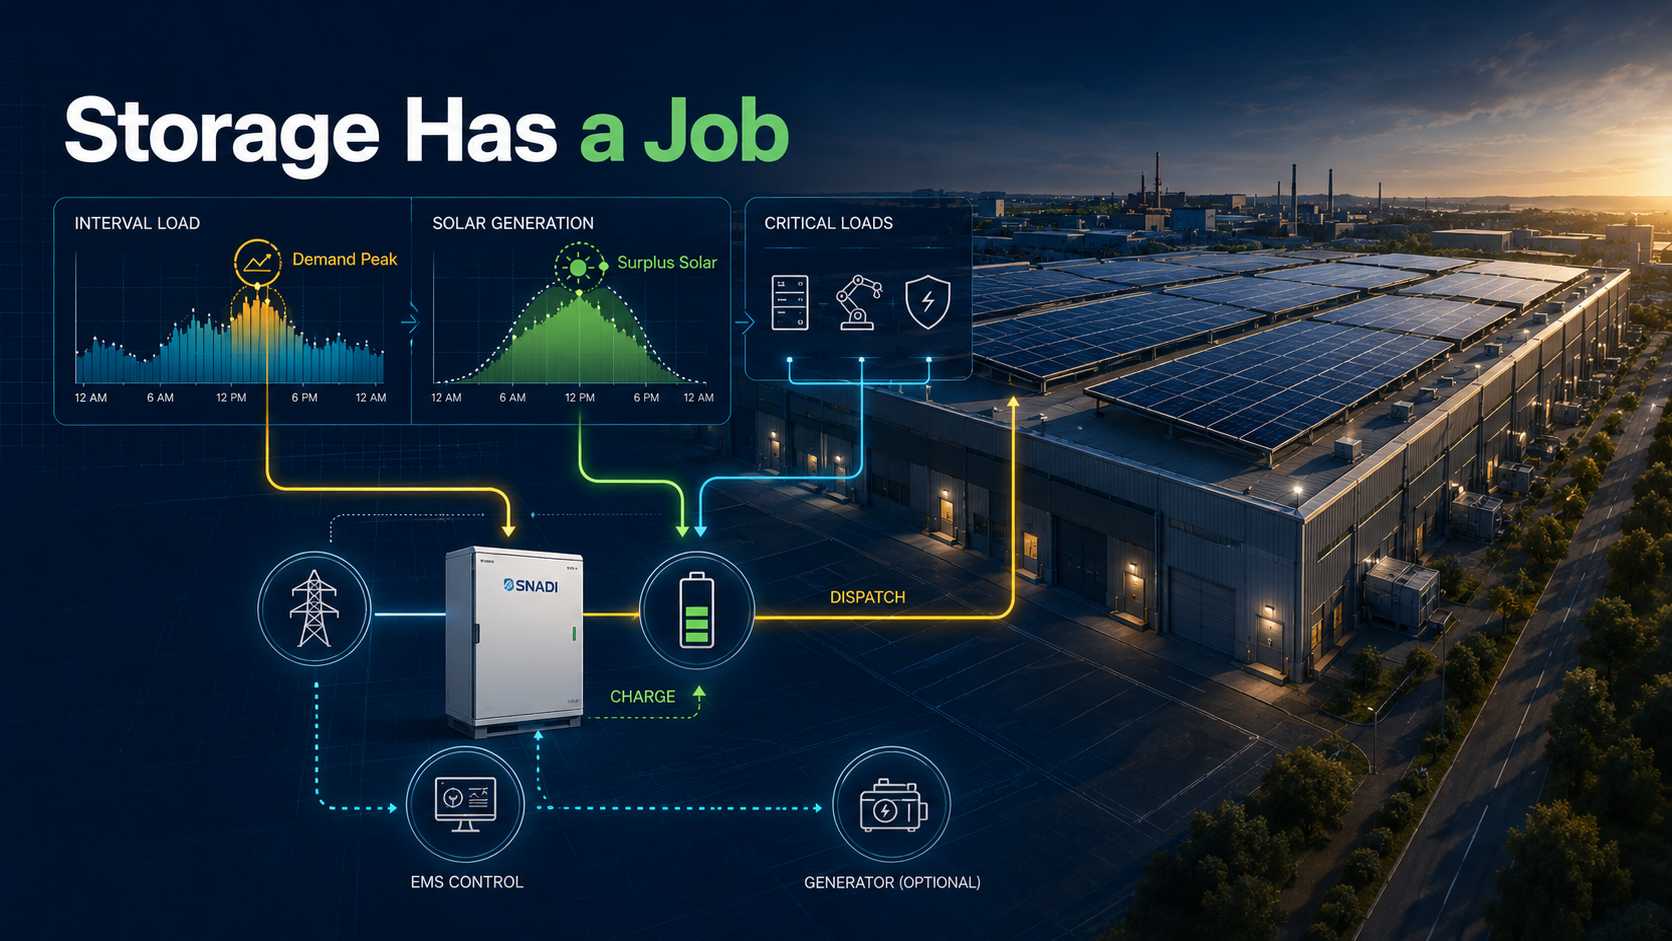
Storage belongs in the discussion when interval data shows a demand peak, when solar surplus has low export value, when selected loads need backup, or when diesel runtime creates a measurable cost. It should not be added only because the project is industrial.
For a medium C&I reference, the SNADI/SNAT Solar 125 kW 241 kWh Integrated Solar Storage Hybrid Power System combines PV input, lithium iron phosphate storage, hybrid inverter functions, grid access, EMS control and optional generator integration. It has 125 kW rated output, 241 kWh rated battery capacity, 250 kW maximum PV input and 228 modules rated at 590 W each.
It lists 380 V or 400 V three phase output, 50 Hz or 60 Hz operation, 10 ms off grid switching, IP54 cabinet protection, EMS scheduling and remote communication. These fields make the system relevant to a factory that has defined critical loads, a suitable connection point and a storage duty. They do not prove a payback period or whole factory backup.
SNADI/SNAT Solar Engineer tip:
A 241 kWh nameplate does not equal 241 kWh of promised backup at every site. Define usable state of charge, reserve, efficiency, temperature derating, ageing allowance and the critical load curve. Ask the EMS supplier to show the dispatch sequence for normal operation, peak control, grid outage and generator support.
We focus on residential, small commercial and C&I inverter, lithium battery and energy storage applications. For this industrial solar project, our role is to help match documented equipment capability to the load, site and operating goal. The local engineer, installer and utility still control the site design, protection and approval path.
Make Acceptance and the First 90 Days Measurable
Commissioning Evidence and Final Drawings
Collect the final single line diagram, string schedule, equipment settings, protection records, test results, labels and commissioning report. Confirm that drawings reflect the installed condition rather than the tender layout.
Monitoring and Alarm Ownership
The plant owner should know who owns the portal account, who receives alarms and how data can be exported. Align meter and inverter timestamps before judging performance. A monitoring screen without an escalation owner is only a display.
Baseline Performance and Invoice Review
Set a baseline period after energisation. Record weather, shutdowns, curtailment, faults and planned maintenance. Compare measured output with the approved model under like conditions, then reconcile the first available utility invoice without claiming that one bill proves annual savings.
O&M Duties, KPIs and Climate Conditions
IEA PVPS Task 13 frames PV O&M around climate conditions, monitoring, performance indicators and contract responsibilities. Use that logic to define inspection frequency, cleaning triggers, fault response, spare parts, vegetation or dust control and reporting ownership for the actual site.
A 90 Day Industrial Solar Stabilisation Plan
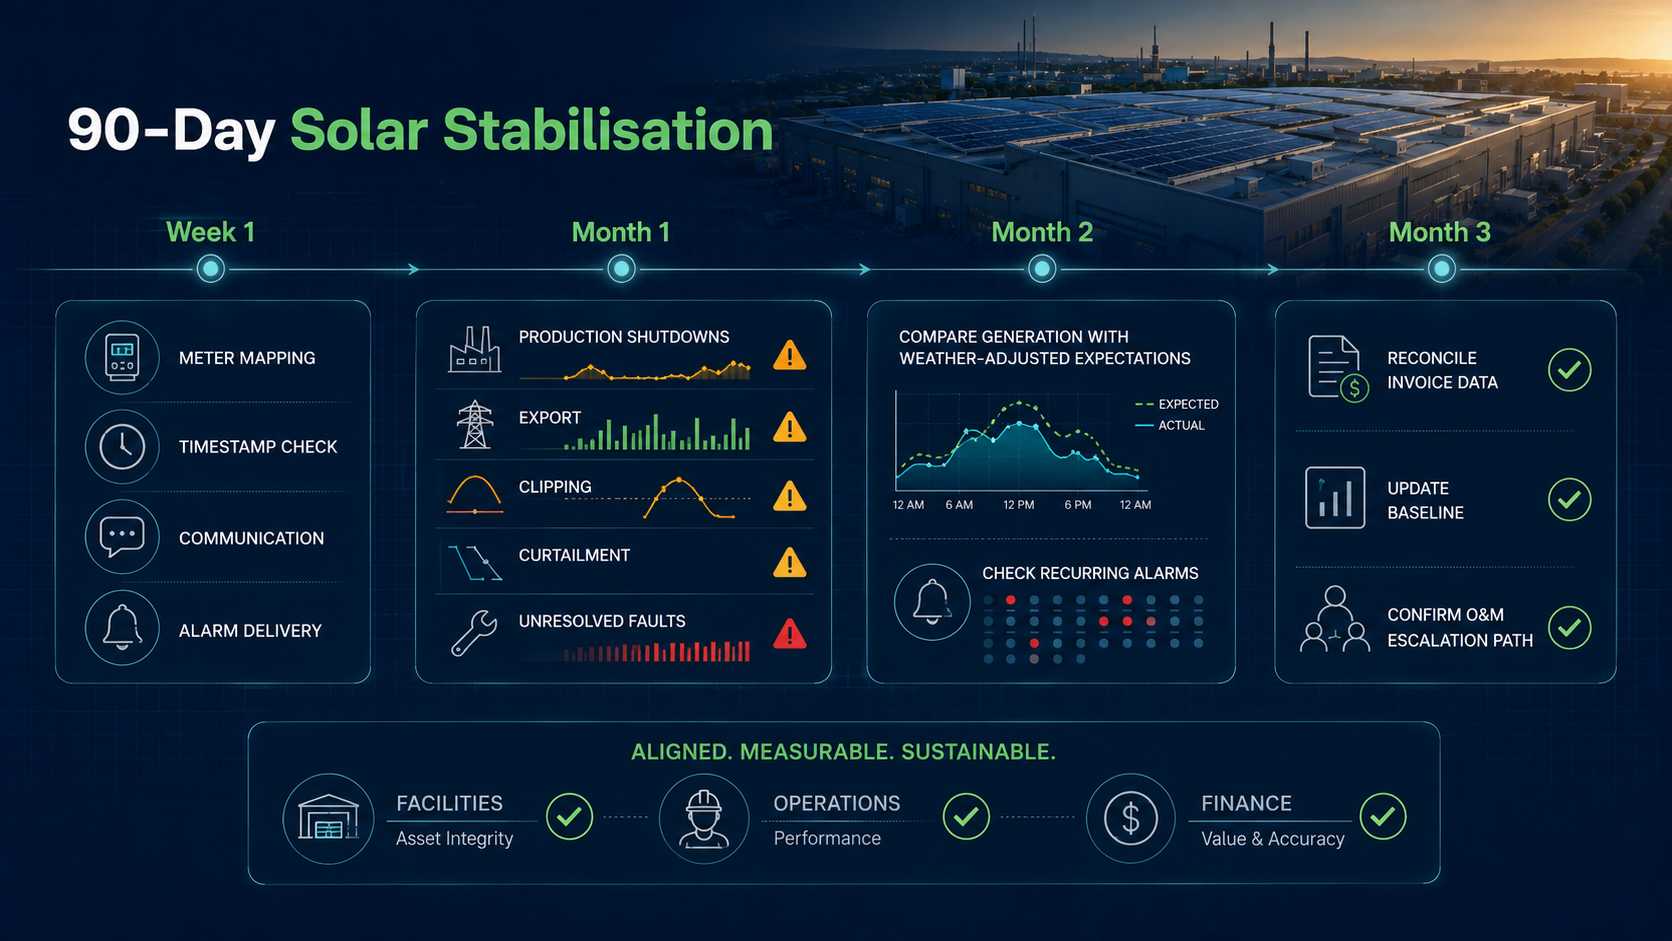
1. During the first week, verify meter mapping, timestamps, communication and alarm delivery.
2. During the first month, log production shutdowns, export, clipping, curtailment and unresolved faults.
3. During the second month, compare measured generation with weather adjusted expectations and check recurring alarms.
4. During the third month, reconcile available invoice data, update the performance baseline and confirm the O&M escalation path.
5. Close the period with facilities, operations and finance signing the same assumptions register.
This sequence protects the buyer from a quiet handover failure. It also gives the supplier evidence for troubleshooting rather than relying on a monthly production total.
Conclusion
Solar panels industrial projects become investable when the meter, production schedule and site constraints lead the design. Industrial solar panels can reduce purchased daytime energy, but demand reduction, resilience and export value require separate evidence.
Before approving an industrial solar power system, align the load envelope, tariff, physical plane, electrical interface, bid assumptions, commissioning records and O&M ownership. When storage has a documented role, review the SNADI/SNAT Solar 125 kW 241 kWh Integrated Solar Storage Hybrid Power System against actual critical loads and the dispatch plan. The next step is a feasibility brief built from bills, interval data, roof information, the single line diagram and the production calendar.
✉️Email: marketing@snadi.com.cn
Website:
☎️WhatsApp / WeChat: +86 1803929353

FAQ
The module technology can be similar. The difference is usually project scale, three phase electrical integration, structural scope, production continuity, procurement evidence and O&M ownership. Select the module from site and system requirements, not from an industrial label alone.
How Do I Size Industrial Solar Panels for a Factory?
Can C&I Solar Panels Reduce Demand Charges?
When Should an Industrial Solar Power System Include Storage?
Does a Large Factory Roof Guarantee a Strong Solar Case?
What Should Be Requested Before Comparing Solar Quotations?