

Solar panels still generate electricity on cloudy days because photovoltaic cells can use scattered light as well as direct sunlight. How well they work cannot be reduced to one percentage. Output changes with cloud type, time, season, array direction, temperature, shading, inverter behavior and the interval being measured.
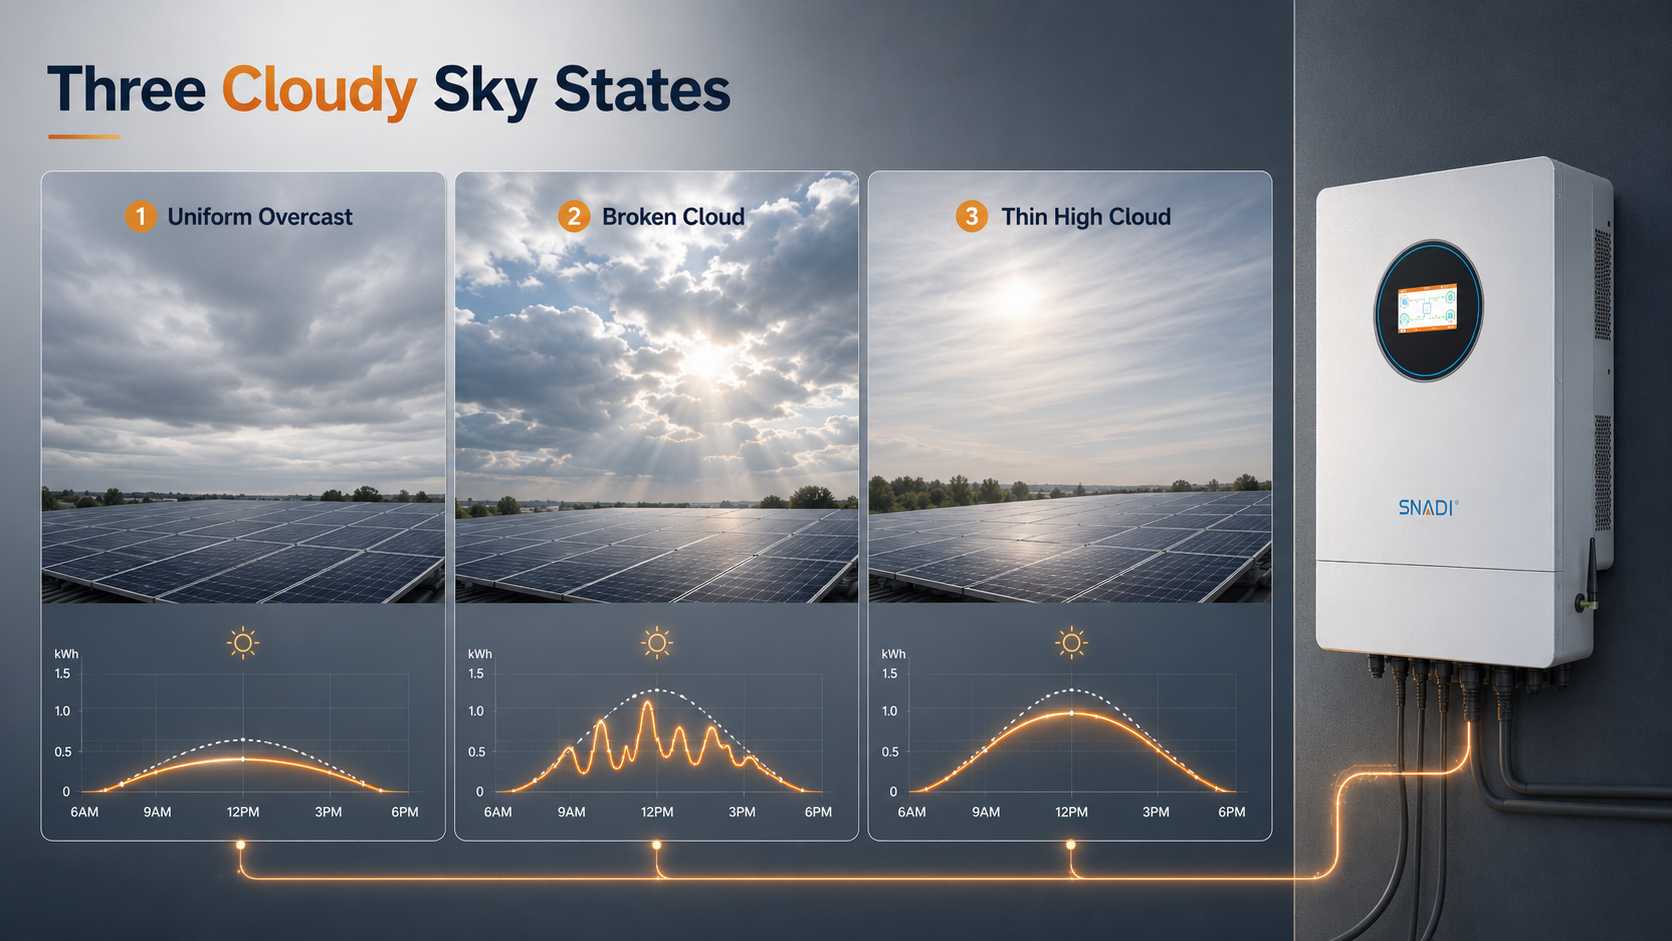
Uniform overcast, broken cloud and thin high cloud can produce very different monitoring curves. Calling all three cloudy hides the information needed for diagnosis. The useful question is how many AC kilowatt hours the system delivers during a defined period, compared with a suitable weather or clear sky baseline.
Sky state | Likely production shape | Main buyer question | Best evidence |
Uniform overcast | Smooth but reduced daily curve | Does accumulated energy match available diffuse light | Hourly energy and irradiance |
Broken cloud | Fast rises and falls with brief peaks | Are ramps caused by moving cloud or equipment behavior | Short interval monitoring and sky record |
Thin high cloud | Clear sky shape with moderate reduction | Is the day compared with the correct seasonal baseline | Weather file and clear sky model |
Uniform overcast often produces a coherent lower arc. Broken clouds can create repeated ramps as shadows move across the array, and reflected light near cloud edges may create short power peaks. Those peaks do not prove that the whole day produced more energy. Thin cloud may preserve the shape of a clear day while lowering the total area under the curve.
A single instantaneous reading is a weak answer to how well do solar panels work on cloudy days. Daily energy tells a different story from the highest power value seen for a few seconds.
Follow the Energy Path From Cloud to Meter
Direct and diffuse light reach the array
Direct normal irradiance describes sunlight arriving directly from the sun. Diffuse horizontal irradiance describes light scattered by clouds, air and particles. Global horizontal irradiance combines direct and diffuse components on a horizontal surface. The United States Department of Energy explains that photovoltaic systems can use both direct and scattered sunlight, which is why production can continue when thick cloud removes the direct beam.
The radiation definitions are covered in the United States Department of Energy Solar Radiation Basics. The remaining diffuse light may still be low. Clouds do not create free energy, and cool panels do not cancel a major irradiance reduction. The energy available to the array remains the first limit.
Array angle converts the sky into a roof input
Weather data on a horizontal surface is not automatically the light received by a tilted array. Tilt, direction, horizon, nearby objects and ground reflection affect plane of array irradiance. A south facing roof, an east and west commercial roof and a ground array can respond differently under the same sky.
Local shade also differs from cloud cover. A chimney or tree may affect one module group or one tracking input while the rest of the array remains stable. Broad cloud tends to affect the whole visible sky, though broken cloud can still produce uneven conditions across a large site.
Modules make DC and the inverter makes usable AC
Modules convert available light into direct current power. Wiring, connectors, tracking inputs and the inverter then determine AC output. Under low light, array voltage and power may approach startup or tracking thresholds. Inverter efficiency can also change with input power.
An owner should check daily AC energy, the curve shape, inverter status and any separate tracking inputs. Module nameplate power alone does not explain cloudy day inverter production.
Loads and storage decide what the energy is worth
A grid connected system may import power when cloud reduces PV output. A battery system may discharge to support selected loads. An off grid system must balance PV energy, current loads, usable battery energy and backup policy over several days.
Storage does not increase cloudy weather solar energy. It shifts available energy in time. The buyer still needs enough generation and a reserve policy that protects the loads that matter.
Power and Energy Answer Different Questions
Power is an instantaneous rate measured in kilowatts. Energy is accumulated production measured in kilowatt hours. A 5 kW array may briefly reach a strong power value between clouds and still produce a low daily energy total if the rest of the day is dark.
Normalized yield, often expressed as kilowatt hours per installed kilowatt, helps compare systems of different sizes. It does not remove the need to check weather, orientation, losses and availability.
Metric | What it tells the owner | Common mistake |
kW | Power at one moment | Treating one peak as the daily result |
kWh | Energy accumulated over time | Comparing days with different daylight periods without context |
kWh per kW | Production normalized by array size | Assuming it removes weather and design differences |
Build a Cloudy Day Estimate From Weather Data
Choose the location and period
Start with the actual site or the nearest defensible weather source. A typical meteorological year is useful for a long term purchase estimate, while an actual historical day is better for checking one monitoring event. Do not compare a cloudy winter day with a clear summer day and call the ratio a panel efficiency result.
Enter the whole system
A solar panel output calculator needs direct current size, tilt, direction, array type, system losses, inverter capacity and weather data. Battery charging, curtailment or export limits may require a separate energy flow model. Record every input so two vendor proposals can be compared with the same assumptions.
Compare hourly AC energy
SNADI/SNAT Solar uses current weather and system modeling methods and reports uncertainty from long term historical weather analysis. Use it as a screening tool, export results when available and keep the model version with the project record. Model output is an estimate, not a site guarantee.
A practical ratio is cloudy day AC kWh divided by a suitable baseline AC kWh. The baseline should use the same season, array, inverter and availability assumptions. Sum interval energy rather than averaging several instantaneous power percentages.
Report a range with uncertainty
Weather variability, model inputs, soiling, local shade, equipment availability and data gaps all affect the result. Report a range and state what could move it. This is more useful to finance than a universal cloudy day percentage taken from an unrelated location.
Read the Production Curve Before Diagnosing a Fault
Smooth reduction often matches uniform weather
A lower but coherent arc across the day can be consistent with uniform overcast. Cross check a nearby weather source, inverter status and whether all monitoring channels follow a similar pattern.
Fast ramps can match broken cloud
Moving clouds can produce repeated rises and falls. Short cloud edge peaks may appear above the surrounding curve, but daily kWh can still remain below a clear day. Compare energy over the full interval before drawing a conclusion.
Persistent tracking input gaps need investigation
If one tracking input or string remains low while the others recover, check alerts, communications, shade, soiling and curtailment records. A clear day with one consistently weak input is not explained by regional cloud alone.
Escalate repeated weather adjusted underperformance
IEC 61724 Part 1 provides a formal basis for photovoltaic monitoring terminology, equipment and performance analysis. A homeowner does not need a laboratory monitoring station, but a repeatable record of weather, energy, system status and data quality makes a service request much stronger.
The monitoring framework is described in IEC 61724 Part 1 Photovoltaic System Performance Monitoring. Do not open energized equipment. Send the installer dates, hourly exports, alarms, fixed angle site photos and recent maintenance history. Escalate when production remains low after weather, shade and known downtime have been considered. Engineer tip: compare seven days, not seven screenshots. Export interval data, note the sky state and use daily AC energy.
Turn Consecutive Cloudy Days Into an Energy Balance
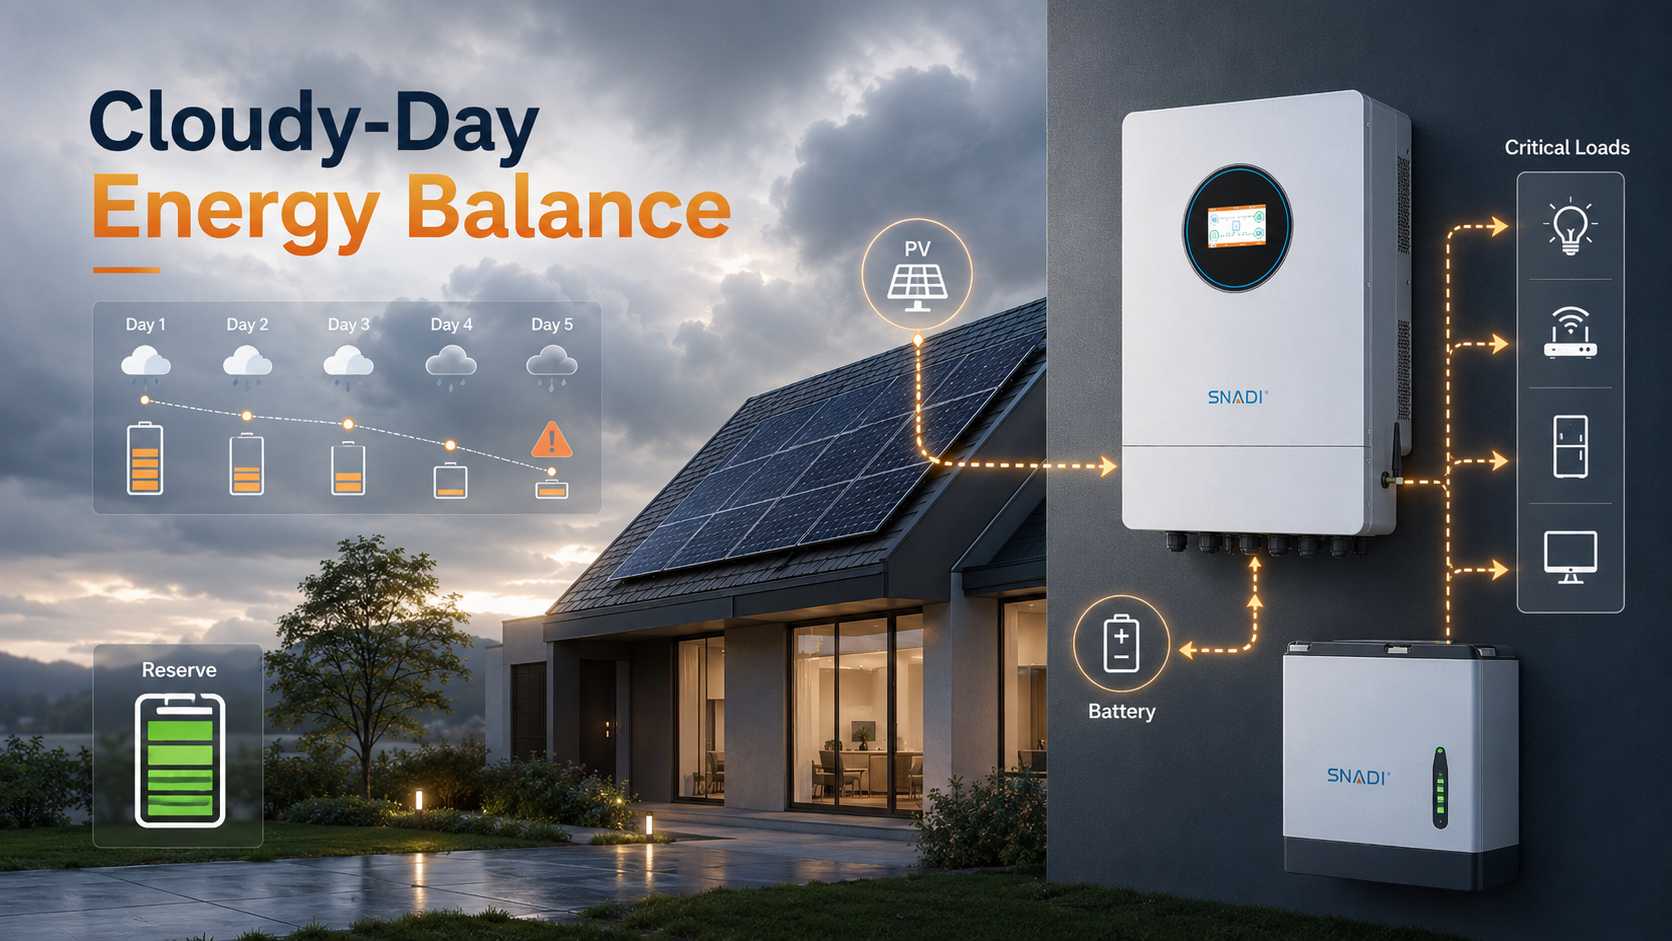
For a grid connected system without storage, shortfalls normally become grid imports. The financial question is annual self consumption and tariff value. For battery backed or off grid systems, the calculation is more direct.
1. Add critical load energy for each day.
2. Subtract modeled cloudy day PV energy available after system losses.
3. Multiply the remaining deficit by the number of low resource days.
4. Add the required reserve.
5. Compare the result with usable battery energy, not nominal capacity alone.
6. Check inverter power and surge demand separately from battery energy.
Consider an illustrative 5 kW array serving 8 kWh of critical loads each day. If the site model estimates only 4 kWh of usable PV energy during one overcast day, the daily deficit is 4 kWh. Two similar days create an 8 kWh deficit before reserve and conversion losses. These numbers demonstrate the method and are not a production forecast.
Design choice | CAPEX effect | OPEX and reliability effect | Main tradeoff |
Larger PV array | Higher module and installation cost | More charging opportunity under weak light | Limited benefit during very dark multi day weather |
Larger battery | Higher storage cost | Longer autonomy and fewer emergency starts | More capacity can remain unused in normal weather |
Critical load panel | Additional design and wiring cost | Protects reserve for priority loads | Some comfort loads remain unavailable |
Backup generator or grid charging | Equipment or energy cost | Reduces outage risk during long low resource periods | Fuel, maintenance, noise or tariff exposure |
Apply the Method to an NKH and BL Configuration
At SNADI/SNAT Solar, we begin with the load and weather balance before choosing equipment. For a residential or small commercial off grid design, the SNADI/SNAT Solar NKH Off Grid Hybrid Solar Inverter is relevant after continuous power, surge load, battery voltage and PV string limits are known. Product specifications are available on the SNADI/SNAT Solar NKH Off Grid Hybrid Solar Inverter page.
The NKH 6000 is published with 6000 W rated output, 48 V battery input, up to 9000 W PV array power, a 60 V to 450 V MPPT range and a 500 V maximum PV open circuit limit. Those values help define array power and string voltage boundaries, but they do not promise a cloudy day energy result. The site weather model still determines how much PV energy is available.
Where multi day backup is required, the SNADI/SNAT Solar BL Lithium Iron Phosphate Battery can enter the calculation after usable energy, reserve and communication are defined. The BL 15000LP model is published at 51.2 V and 314 Ah with 16076.8 Wh nominal energy. Actual backup time must use the approved discharge window, inverter losses, battery condition, temperature and load profile. The local manual also places this battery in an indoor IP20 environment, so installation location is part of the selection. Battery specifications are available on the SNADI/SNAT Solar BL Lithium Iron Phosphate Battery page.
This combination makes sense when the buyer needs off grid conversion, MPPT charging, monitored battery storage and a defined critical load plan. It is a poor fit if the design ignores cold PV voltage, battery communication, protective devices, ventilation or multi day energy balance.
Run a Seven Day Weather to kWh Check
Use one week to create a practical field record. Record the date, daylight period and sky state. Export hourly AC energy and inverter status. Note peak power, but do not use it as the daily result. Record battery state of charge at the same times each day. Note shade, soiling, outages and curtailment. Compare each day with a weather model or suitable baseline, then escalate repeated gaps that weather does not explain.
Fixed angle photos of the sky and array can help without asking anyone to climb on the roof. Exported data is stronger than manually transcribed values because it preserves time intervals and reduces errors. A repeatable record also helps separate normal weather variation from communication loss, shading, soiling or equipment underperformance.
Conclusion
The best answer to how well do solar panels work on cloudy days is measured in daily and annual kWh, not in one borrowed percentage. Panels use diffuse sunlight, but output still depends on cloud type, season, array geometry, inverter behavior and system availability.
Classify the sky, model the site, compare hourly AC energy and keep a seven day record. For battery backed or off grid buyers, convert consecutive low resource days into a critical load deficit before choosing inverter power and usable storage. At SNADI/SNAT Solar, that evidence lets us discuss an NKH inverter and BL battery as parts of a verified energy plan rather than as a promise that equipment can remove weather risk.
✉️Email: marketing@snadi.com.cn
Website:
☎️WhatsApp / WeChat: +86 1803929353

FAQ
Yes, when enough diffuse light reaches the array and the system is operating. Energy can be much lower than on a clear day, so the result needs a defined site, time interval and weather condition.
What percentage should I expect on a cloudy day?
Can solar panels charge a battery when it is cloudy?
How can I tell clouds from a system problem?
What is the difference between kW and kWh on a cloudy day?
How many cloudy days should a battery system cover?