

Open the inverter app at noon, sees a gray sky and finds that a roof rated at several kilowatts is producing only a fraction of its nameplate power. The immediate question is simple: do solar panels work when cloudy, or does the low number point to a panel, installation or inverter problem?
Solar panels can still produce electricity under clouds. The dashboard number must still be read against the correct time period and system goal. A short power dip, a low daily energy total and an empty battery after several dark days are three different problems. They need different evidence.
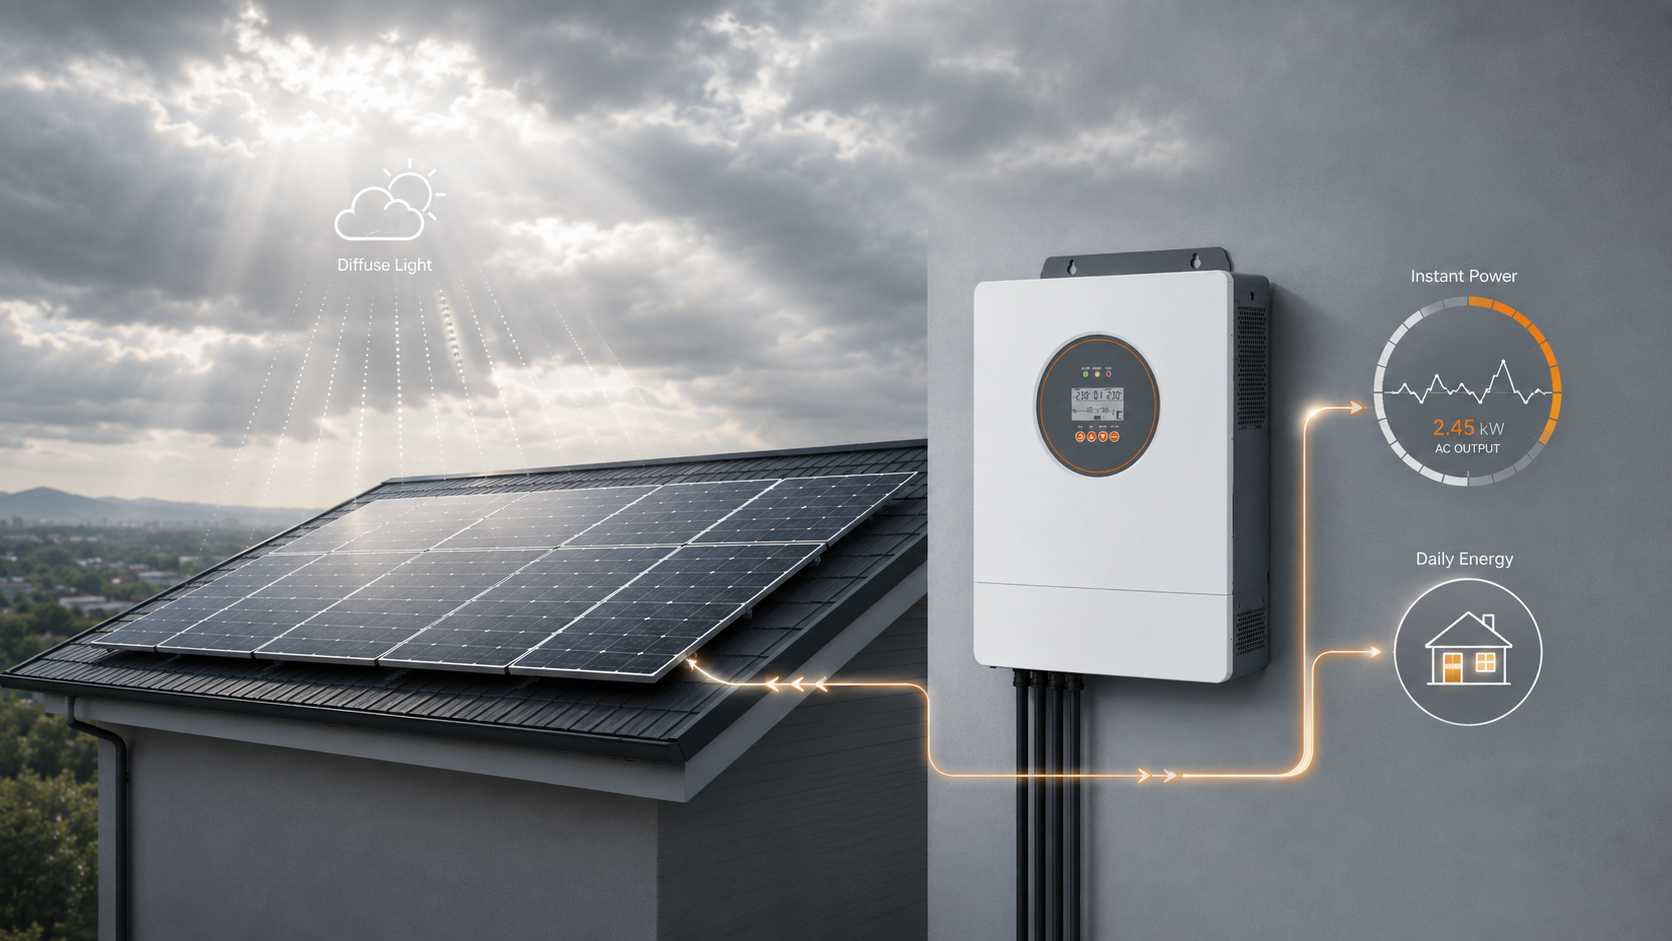
Panels respond to sunlight reaching the cells, not to the color of the sky. Cloud layers scatter and reflect much of the direct beam, while some diffuse light can still reach the roof. The United States Department of Energy describes global solar radiation as the combination of direct and diffuse radiation and notes that thick clouds can remove the direct beam component. Production can continue without a visible sun, but available power may be far below a clear sky reading.
Brief peaks under broken clouds can also confuse the picture. A dashboard may show a fast rise when sunlight reaches the array between moving cloud edges, then fall again seconds later. That moment does not describe the full day. The useful comparison is energy over the interval that matches the buyer decision.
Choose the Weather Clock Before Reading a Percentage
The same array can look poor on one clock and useful on another. Select the clock first, then collect the matching data.
Right Now
Instantaneous AC power answers whether the inverter is producing at that moment. It can help identify a shutdown, alarm or power limit. It cannot estimate the energy delivered over the rest of the day. Fast cloud movement can create steep ramps, so a single screenshot is weak evidence unless it includes time, weather and inverter status.
One Full Day
Daily energy answers whether solar made a meaningful contribution to that days load. Compare total AC energy with local weather evidence and a suitable expected range from the system design. Check whether the battery charged, whether export was limited and whether high loads consumed solar directly. A low noon peak can coexist with a useful daily total, while a short bright peak can hide a poor day.
A Cloudy Sequence
Several low resource days shift the decision from panel output to energy balance. The buyer needs usable battery energy, daily critical load energy, expected solar recharge and a reserve or backup rule. Solar production during a cloudy week cannot be inferred from one daytime power figure. It requires a sequence model with an explicit load budget.
A Month or Year
Monthly and annual energy matter for bill savings and return expectations. A cloudy afternoon does not prove that an installation is uneconomic. A proposal should state the weather data source, array assumptions, system losses and expected monthly AC energy. Actual results should be compared over enough time to separate a weather event from a persistent design or equipment issue.
Weather clock | Decision it supports | Data to read | Shortcut to avoid |
Right now | Is the inverter operating | AC power, mode, alarms and local sky condition | One screenshot as a performance verdict |
Full day | Did solar serve useful energy | Daily AC energy, load, battery movement and weather record | Noon power as daily energy |
Cloudy sequence | Can critical loads continue | Usable battery energy, daily load, recharge and reserve rule | Battery size alone as backup time |
Month or year | Is yield meeting the plan | Monthly energy, model basis, losses and tariff outcome | One cloudy day as an ROI result |
Build a Cloudy Weather Card
The minimum card has four parts: site and array details, weather resource, electrical output and operating state. Record location, array tilt and direction, module and inverter model, timestamp and time zone. Then add irradiance or a reliable local weather source, AC power or energy, battery state, load, operating mode and alarms.
For cloudy weather monitoring, align timestamps before comparing curves. A weather service may report in local civil time while the inverter portal uses another time zone. A ten minute production interval should not be compared with an hourly weather average as if both describe the same event. Missing samples, communication gaps and an incorrect meter direction can also create false conclusions.
IEC 61724 Part 1 provides terminology, equipment and methods for photovoltaic performance monitoring and analysis. Its monitoring context reinforces a basic operating rule: preserve timestamps, sensor context and system state before diagnosing low output.
A small buyer does not need an elaborate monitoring station for every roof. The useful discipline is to define what is measured, how it is measured and which operating state belongs to the data before judging performance. That makes a modest inverter record more valuable than a dashboard filled with readings that have no time or sensor context.
SNADI/SNAT Solar Engineer tip:
Save a normal clear day and one representative cloudy day from the same system. Keep the same time range, load context and time zone. The paired records give an installer more diagnostic value than a photo of one low number.
Clouds, Shade and Faults Leave Different Evidence
Clouds usually affect a broad area and move with local weather. Fixed shade often repeats at similar times because a tree, chimney, parapet or neighboring structure crosses the same part of the array. Roof features and trees as common sources of shade that reduce energy yield. This is an industry view rather than a universal diagnostic rule, but it explains why repeated geometry deserves separate investigation.
Dirt can create a slower and more persistent loss. A fault may produce an alarm, an unavailable MPPT channel, repeated shutdowns or a pattern that does not recover under better weather. Export limits and battery charge limits can deliberately reduce inverter output even when the array could produce more. The app curve must therefore be read with operating mode and load flow, not weather alone.
Observed pattern | First evidence to check | Do not assume | Next action |
Whole array follows moving cloud | Local irradiance, nearby systems and weather timeline | A panel fault from one dip | Compare daily energy and repeat under clearer conditions |
Loss repeats at the same clock time | Roof geometry, shade image and MPPT grouping | Regional cloud as the only cause | Request a shade and string review |
Flat output ceiling | Export setting, battery limit, inverter mode and load | More panels will raise usable output | Confirm control settings and connection rules |
Sudden zero or missing data | Alarm log, AC and DC status and communications | Weather caused a shutdown | Preserve codes and contact qualified service personnel |
Persistent lower energy | Soiling, shade, module mismatch and baseline | One cloudy percentage proves normality | Compare like periods and inspect the site |
Do not open electrical enclosures or change protection settings to test a theory. The useful owner action is to preserve evidence. Electrical inspection belongs with qualified personnel who can follow the equipment manual and local rules.
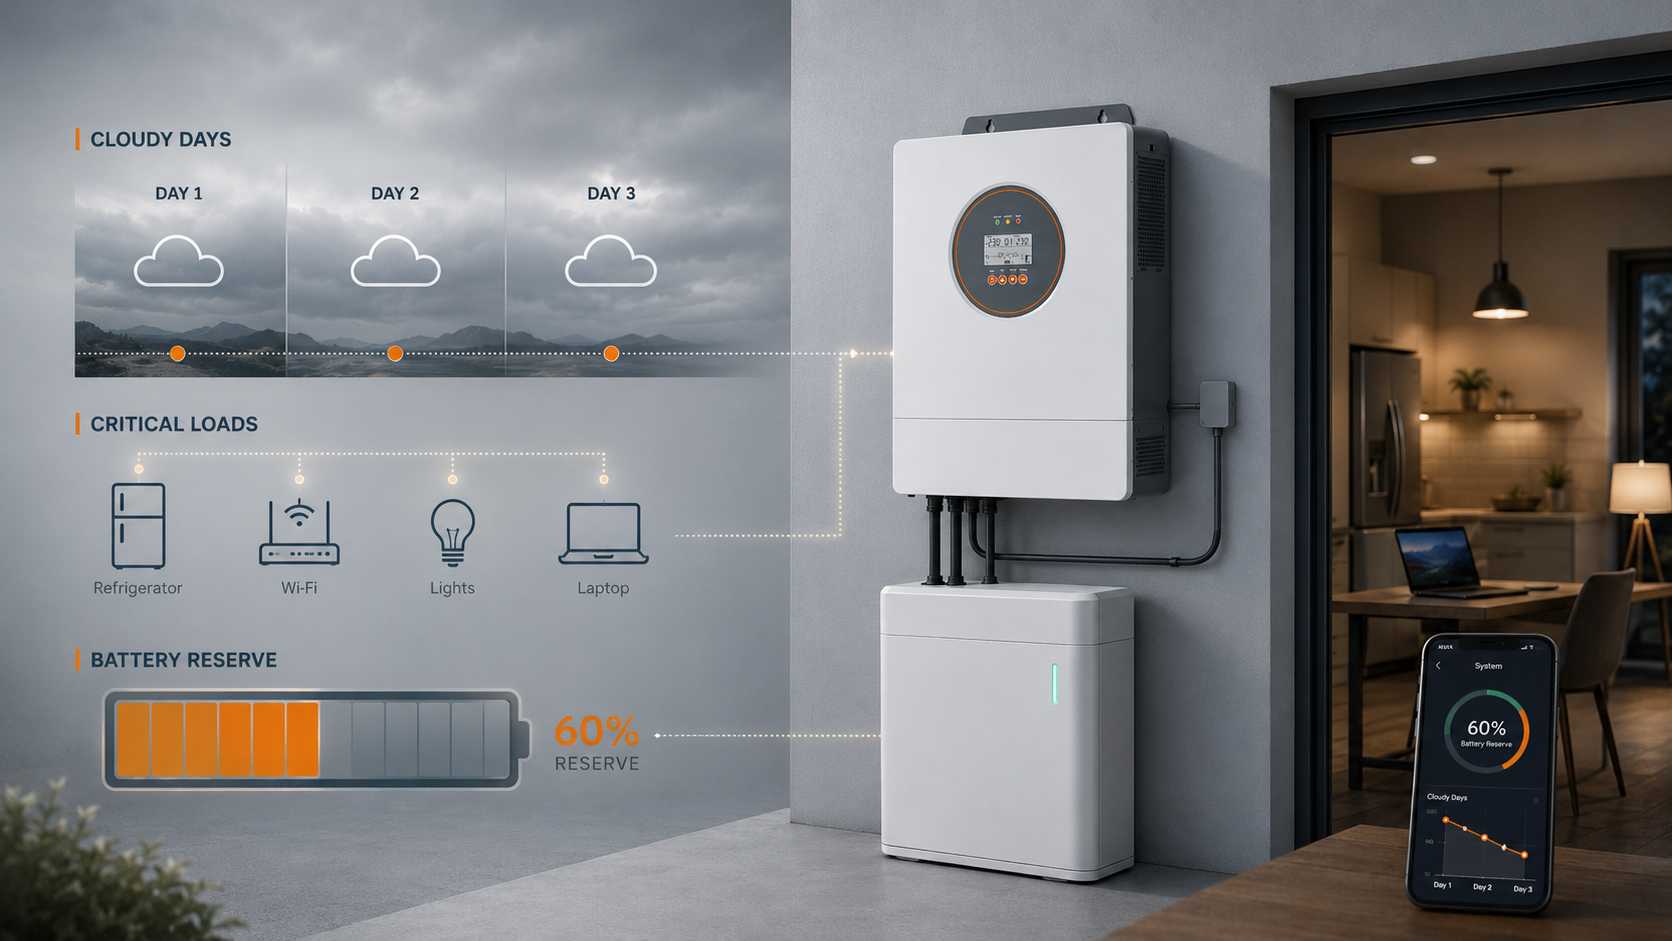
Plan Critical Loads for a Cloudy Sequence
Solar battery planning for cloudy days begins with loads, not with a battery label. List the devices that must continue, their average watts and required hours. Convert each line to daily watt hours, add realistic conversion and standby losses, then compare the result with usable battery energy rather than nominal capacity. Finally, model a conservative solar recharge range for the relevant low resource sequence.
A refrigerator, router, selected lights and payment terminal form a different design target from electric cooking, water heating or air conditioning. Keeping high energy loads outside the critical load panel can reduce CAPEX and extend reserve. The trade off is that the owner must accept a narrower backup service during poor weather.
Battery autonomy also depends on minimum state of charge, battery temperature, discharge limits, inverter idle use and whether the grid or a generator is available. More storage raises CAPEX and may sit partly unused in normal weather. Less storage lowers purchase cost but raises the chance of reaching the reserve threshold. Buyers should check measured loads, usable battery energy, charging limits, backup source and the longest relevant cloudy sequence before choosing a system.
For residential and small commercial projects where weather monitoring and future storage are part of the brief, our SNADI/SNAT Solar ES IP54 On/Off Grid Solar Inverter EURO can be considered after the load and array voltage are confirmed. The published range includes 6.2 kW and 12 kW models, IP54 protection, battery free operation, optional WiFi, and USB and RS485 communication. These capabilities can support a PV first design or a monitored hybrid layout, but inverter power does not determine battery duration.
A 12 kW inverter paired with a small usable battery may support a high load briefly, while a lower steady critical load may run much longer. When we review this inverter for cloudy weather system sizing, we check PV open circuit voltage, MPPT operating range, continuous and surge load, battery voltage, communication compatibility, installation exposure and the owner monitoring responsibility. Optional remote access is valuable only when someone receives alarms and knows what action follows.
Turn One Cloudy Day Into a Useful Monitoring Record
Create one event record instead of collecting disconnected screenshots.
1. Write the event start and end time with the time zone.
2. Note whether the sky was uniform overcast, broken cloud or rain and whether fixed shade was present.
3. Save AC power, daily energy, battery state, load and operating mode for the same interval.
4. Export alarm and event codes without resetting them.
5. Identify the weather or irradiance source and its time resolution.
6. Compare the event with a clear reference day and the design expectation.
7. State the decision needed: normal weather explanation, battery review, shade study or service visit.
This record prevents two common mistakes. The first is paying for a site visit when the system was operating normally under weak irradiance. The second is accepting weather as an explanation for a repeatable shade or fault pattern. Good evidence reduces both OPEX and downtime risk.
Conclusion
The practical answer is yes, solar panels work when cloudy, but that answer is only the starting point. A buyer should decide whether the concern is current operation, daily energy, battery coverage through a cloudy sequence or monthly yield. Each clock needs its own data.
Before changing equipment, build a local card with weather context, array details, AC output, load, battery state and alarms. That record shows whether the next step is simply to keep observing, revise the critical load budget, investigate repeatable shade or request qualified service.
For a new system, send the same information with the required backup hours so we can review inverter power, PV voltage, storage and monitoring as one engineering decision. A generic weather percentage cannot replace that site specific review.
✉️Email: marketing@snadi.com.cn
Website:
☎️WhatsApp / WeChat: +86 1803929353

FAQ
They can produce from diffuse light, but the amount depends on local solar resource and system conditions. Thick cloud may remove the direct beam component, so a universal panel output percentage is not reliable.
How Much Power Do Solar Panels Produce on Cloudy Days?
Do Solar Panels Charge Batteries When Cloudy?
Can a Battery Cover Several Cloudy Days?
How Are Cloud and Fixed Shade Patterns Different?
When Should Low Output Be Escalated as a Fault?