

For most solar buyers, system size is not the first question. The first question is usually financial: how long will it take to recover the investment?
The solar payback period estimates how many years it takes for electricity savings and other financial benefits to equal the net cost of the solar system.
To estimate the payback of solar properly, you need to know how much energy the system will actually deliver, how much of that energy will be used on-site, what exported electricity is worth, and what costs the system will carry over time.
For projects in Latin America, this matters even more because electricity tariffs, export rules, financing conditions and solar resources vary widely between markets.
What Is the Solar Payback Period?
The solar payback period is the time required for cumulative savings to recover the initial net investment in a solar project.
For example, if a solar system costs USD 10,000 after applicable incentives and produces USD 1,500 in net savings each year:
USD 10,000 ÷ USD 1,500 = 6.7 years
The project reaches its simple break-even point after about 6.7 years. Savings generated after that point continue to contribute to the project's financial return.
The IEA notes that higher retail electricity prices are helping support distributed solar PV deployment in Latin America. The reason is straightforward: when grid electricity costs more, each kilowatt-hour of solar energy consumed on-site can avoid a more expensive grid purchase. Electricity rates, irradiation, installation costs, financing, tax treatment and distributed-generation policies differ between countries and even between utility service areas.
How to Calculate the Solar Payback Period
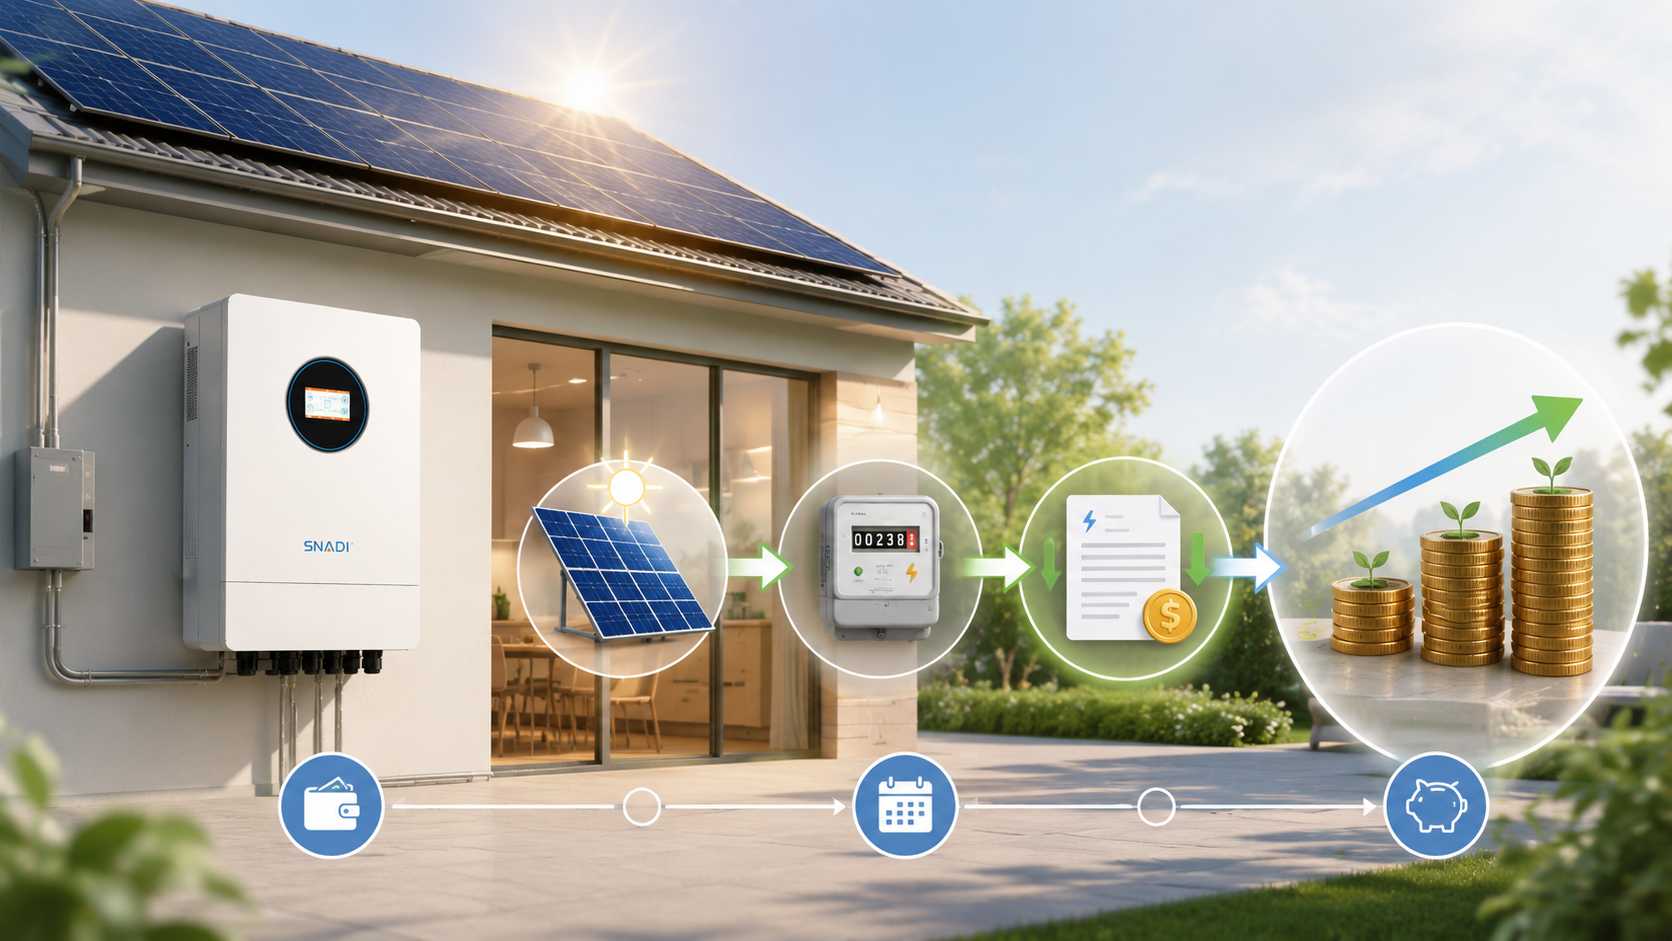
Solar Payback Period Formula
The basic formula is:
Solar Payback Period = Net System Investment ÷ Annual Net Savings
Step 1: Calculate Net System Cost
Start with the full project cost rather than the module price.
Depending on the installation, CAPEX may include:
PV modules
solar inverter or hybrid inverter
battery storage, if required
mounting structure
combiner boxes and protection equipment
electrical cables
installation labor
engineering and permitting
monitoring equipment
financing charges
taxes
logistics
Step 2: Estimate Annual Solar Production
Installed capacity tells you how large the array is. It does not tell you exactly how much electricity the system will produce over a year.
Annual PV generation depends on factors such as:
local solar irradiation
module orientation
array tilt
shading
operating temperature
dust and soiling
wiring losses
inverter losses
module mismatch
This is why a 10 kW array should not be evaluated simply by multiplying 10 kW by assumed sunlight hours and 365 days.
A proper production estimate should account for the actual site and realistic system losses.
Step 3: Calculate the Real Value of Solar Energy
A kilowatt hour used inside the building may be worth much more than a kilowatt-hour exported to the grid.
For a grid connected system, a simplified calculation is:
**Annual Energy Value ≈(Self-Consumed Solar × Retail Electricity Rate) * (Exported Solar × Export Compensation)**
Consider a business that pays USD 0.18/kWh for grid electricity but receives only USD 0.05/kWh for exported solar power.
A solar kilowatt-hour consumed directly on-site avoids a USD 0.18 grid purchase. If that same kilowatt-hour is exported, its financial value is only USD 0.05.
Step 4: Subtract Operating Costs
Solar has relatively low operating costs, but “low” does not mean zero.
If an inverter fault leaves part of the system offline for several weeks, the financial loss is not limited to the repair bill. The site also loses the electricity savings that the system should have produced during that period.
Solar Payback Period Calculation Example
Consider an illustrative 8 kW grid-connected solar system for a small commercial property.
Variable | Example |
Net installed cost | USD 9,800 |
Annual PV generation | 12,000 kWh |
Self-consumption | 70% |
Grid electricity price | USD 0.16/kWh |
Export value | USD 0.05/kWh |
Annual O&M allowance | USD 120 |
Value of self-consumed solar | USD 1,344 |
Value of exported solar | USD 180 |
Net annual savings | USD 1,404 |
Simple payback | About 7.0 years |
The calculation works as follows.
Self-consumed energy:
12,000 × 70% = 8,400 kWh
Avoided grid purchases:
8,400 × USD 0.16 = USD 1,344
Exported energy:
3,600 × USD 0.05 = USD 180
Net annual benefit:
USD 1,344 + USD 180 − USD 120 = USD 1,404
Simple payback:
USD 9,800 ÷ USD 1,404 ≈ 6.98 years
What Factors Change the Payback of Solar?
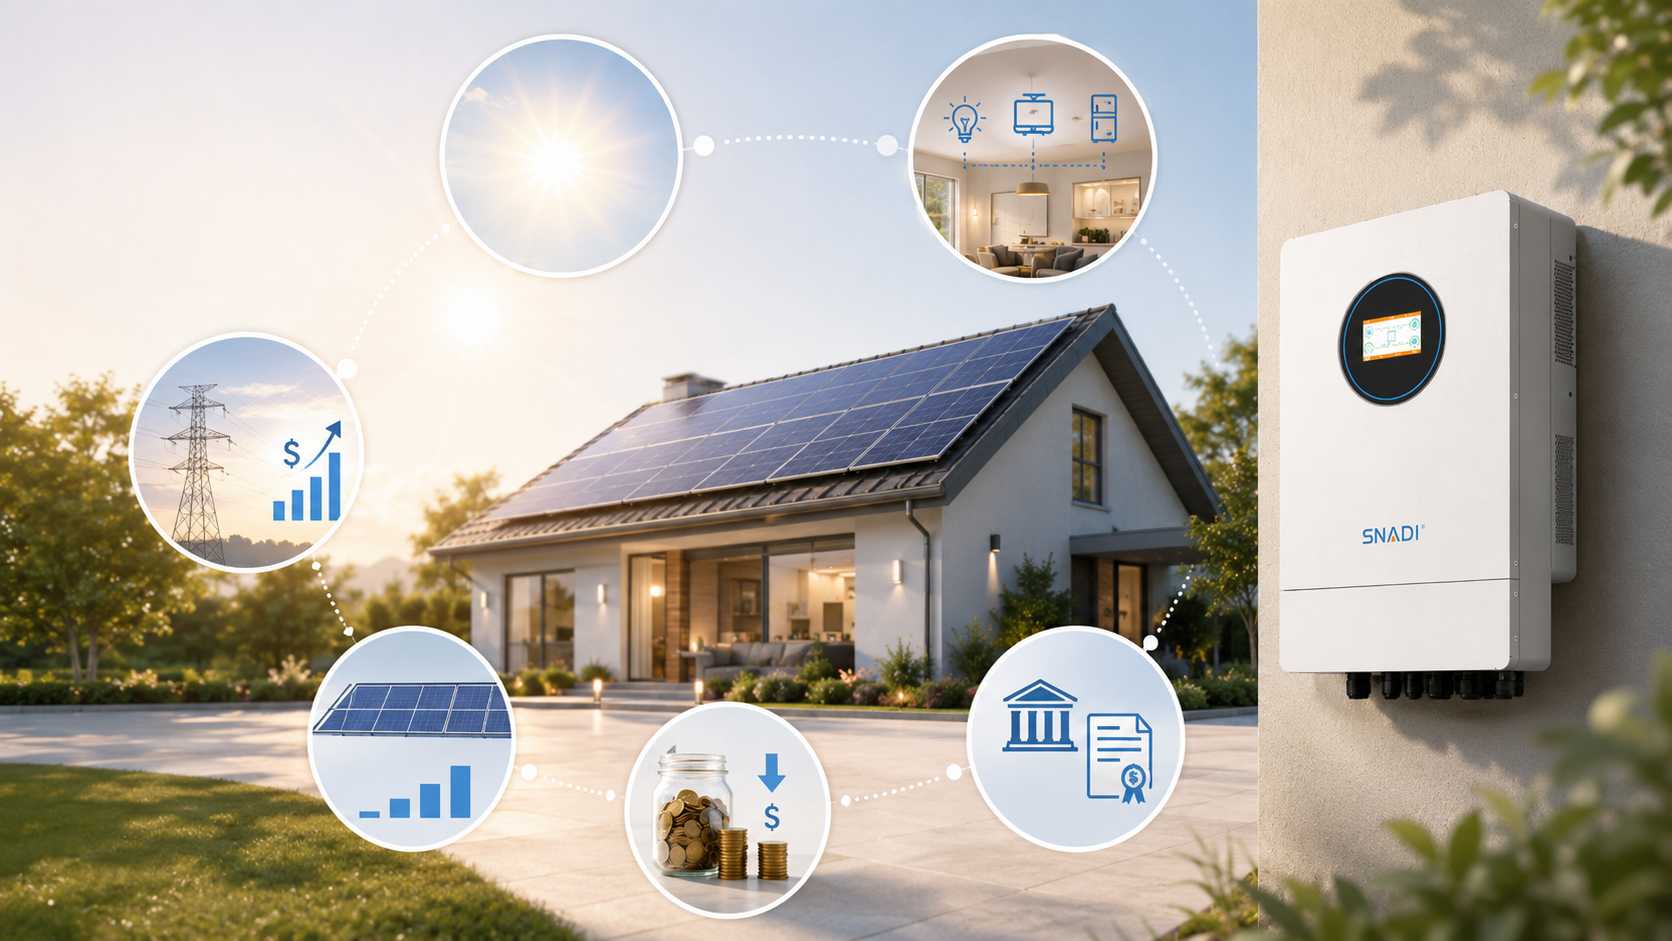
Electricity Tariffs
Electricity price is one of the strongest drivers of solar payback.
When a business uses solar power instead of buying electricity from the grid, the value of that solar energy is closely tied to the avoided tariff.
Higher tariffs can therefore shorten payback, especially at sites that consume a large share of their solar production during operating hours.
Solar Yield and Site Conditions
Two systems with the same installed capacity can produce different amounts of electricity.
Location, shading, roof orientation, temperature, dust, tilt angle and equipment configuration all affect annual generation.
For payback calculations, expected annual kWh matters more than the installed kW figure by itself.
Self-Consumption and Export Compensation
Load profile is especially important in commercial projects.
A factory, warehouse or workshop operating heavily from morning through late afternoon may consume a large percentage of its PV generation directly.
A site with little daytime demand may export much more electricity.
If the utility pays significantly less for exported power than the customer pays for grid electricity, oversizing the array can work against the project economics. CAPEX increases, but annual savings may not increase at the same rate.
Financing
A cash-purchase project and a financed project can have very different economics even when the equipment is identical.
Interest, loan fees and repayment structure all affect the true cost of the system.
equipment price, installed CAPEX and total financed cost must be separated.
Otherwise, a low monthly payment can make an expensive financing structure look more attractive than it actually is.
Inverter and System Losses
The inverter is part of the energy-conversion chain between the PV array and the site's AC loads.
Conversion efficiency matters, but it is not the only issue.
Incorrect string design, MPPT mismatch, thermal derating, inappropriate inverter sizing and equipment downtime can all reduce the amount of usable energy delivered by the system.
A small percentage of lost production may not look significant on a specification sheet. Across many years of operation, however, that lost energy also means lost savings.
Maintenance and Downtime
The lowest equipment quotation does not automatically produce the shortest payback period.
A small saving at the procurement stage can disappear quickly if a fault later keeps the system offline while installers wait for diagnosis, technical support or replacement parts.
For commercial buyers, service response and equipment availability are therefore part of the financial model, not just after-sales considerations.
How Does Inverter Performance Affect Solar Payback?
An inverter does not increase the amount of sunlight reaching the modules. What it can affect is how effectively the available PV energy is converted into usable electricity and how consistently that conversion continues over the life of the system.
Several specifications deserve attention.
Conversion efficiency: Lower conversion losses allow more PV energy to reach AC loads or the grid.
MPPT operating range: PV string voltage needs to stay within the inverter's intended operating window. Poor string-to-inverter matching can reduce energy harvest.
Thermal performance: In hot installation environments, check how the inverter behaves as ambient temperature rises. A headline efficiency value measured under controlled conditions does not describe the complete operating picture.
Reliability and serviceability: An efficient inverter produces no savings while it is offline. Fault diagnosis, technical support and replacement availability therefore matter alongside electrical specifications.
Engineer's Tip: Do not choose an inverter from nominal kW alone. Check PV input voltage, MPPT range, maximum PV input power, phase configuration, battery voltage where applicable, ambient-temperature requirements, enclosure rating and the expected load profile.
For projects that require hybrid or off-grid operation, these checks also help determine whether the inverter configuration matches the actual PV array, battery bank and load rather than simply matching the system's headline power rating.
Does Adding a Battery Shorten the Solar Payback Period?
Not necessarily.
Adding battery storage increases the initial system cost, so a solar-plus-storage project can have a longer simple payback period than a comparable solar-only system.
The question is whether the battery solves a problem that has measurable financial value.
Solar Only | Solar + Battery |
Lower initial CAPEX | Higher initial CAPEX |
Well suited to strong daytime consumption | Can shift solar energy into evening or peak periods |
Excess PV may be exported | Can increase solar self-consumption |
Limited backup capability without additional equipment | Can support selected backup loads |
Payback depends heavily on tariff and export rules | Economics depend on cycling, tariff spread and backup value |
Simpler system architecture | More components and control requirements |
Storage becomes more interesting financially when it can reduce a defined cost or operational risk,
Brazil provides one example of why application matters. EPE modelling indicates that behind-the-meter batteries may already be economically viable in some applications when system costs fall below roughly BRL 2,000/kWh, including cases where batteries replace diesel generation during peak periods.
The same EPE analysis also indicates that payback remains long in many other battery applications.
In other words, battery economics should be calculated from what the battery is expected to do. Adding storage simply because it is available does not guarantee a better return.
Solar Payback Period for Commercial and C&I Projects
Commercial solar calculations often require more detail than a residential electricity-bill comparison.
For a warehouse, factory, hotel, cold-storage facility or workshop, the project model may need to account for:
daytime electricity consumption
peak shaving
demand-charge reduction
outage-related production losses
diesel fuel displacement
generator maintenance
battery charge and discharge strategy
This is why monthly electricity consumption alone is often insufficient for a C&I project. Two facilities using the same monthly kWh can have very different hourly load curves and therefore very different levels of solar self-consumption.
Battery sizing also needs to follow the load.
If a site needs 50 kW continuously for four hours, the theoretical energy requirement is 200 kWh. That figure is only a starting point. Usable depth of discharge, inverter losses, reserve capacity and changes in load still need to be considered before choosing the actual battery size.
For buyers evaluating commercial energy storage, applications such as peak shaving, load shifting, solar self-consumption and backup should therefore be assessed separately rather than grouped under a generic “battery system” calculation.
Solar Payback Period vs Solar ROI
Payback period and ROI describe different parts of the financial picture.
Payback period asks:
How long will it take to recover the initial investment?
ROI asks:
How much financial return does the project generate relative to its cost?
A basic ROI calculation is:
ROI = (Lifetime Financial Benefits − Lifetime Costs) ÷ Initial Investment × 100%
Two systems may both show a seven-year payback while having very different maintenance costs, financing costs, degradation assumptions and replacement risks over their operating lives.
For larger commercial and C&I projects, simple payback is better used alongside metrics such as NPV, IRR and discounted cash flow rather than as the only investment criterion.
How to Shorten the Solar Payback Period
Reducing payback is not simply a matter of finding the cheapest equipment. The goal is to produce more financially valuable energy without adding unnecessary project cost.
In practice, that usually means:
Size the PV array around the site's actual load profile.
Increase direct solar self-consumption where the tariff structure rewards it.
Verify export compensation before adding excess PV capacity.
Compare the full cost of financing rather than monthly repayments alone.
Match inverter input limits and MPPT ranges to the PV array.
Keep wiring and conversion losses under control.
Add storage only when its operating purpose and financial value are clear.
Plan monitoring and maintenance before the system is commissioned.
Select equipment for the site's real temperature, humidity, dust and installation conditions.
Include potential downtime when comparing suppliers and service arrangements.
What Buyers Should Check Before Choosing a System
A payback figure is only as reliable as the assumptions behind it.
Before approving a solar or storage quotation, check the following inputs.
Load data: Monthly kWh may be adequate for a rough residential estimate, but many commercial projects need hourly or interval consumption data.
PV production estimate: Ask which irradiation source, loss assumptions and operating conditions were used.
Self-consumption assumption: If the model assumes 90% self-consumption, the site's actual load curve should support that figure.
Electricity tariff: Separate energy charges, time-of-use rates and demand charges where applicable.
Export rules: Confirm the current compensation mechanism for exported electricity in the project's location.
Battery purpose: Define whether storage is intended for backup, peak shaving, self-consumption, load shifting or several functions at once.
Inverter sizing: Check DC/AC ratio, MPPT voltage range, phase configuration, surge requirements and battery compatibility.
Installation environment: Heat, moisture, dust and outdoor exposure can influence equipment selection and operating performance.
Service plan: Determine who will diagnose faults, how technical support will be provided and how replacement components can be obtained.
If those inputs are vague, the payback figure will be vague as well.
Is Solar Worth It After the Payback Period?
The payback date is not the end of the project's economic value. It is simply the point at which accumulated savings are estimated to have recovered the initial investment.
If the system continues operating effectively after that point, it can continue reducing electricity costs, subject to tariffs, maintenance requirements and equipment performance.
That figure should not be inserted into a residential or commercial payback calculation. Utility-scale LCOE and behind-the-meter solar payback measure different things. It does, however, provide useful context for the continuing decline in the cost of solar generation.
Latin America's distributed PV market is also expanding. In Brazil, photovoltaic installed capacity increased 33.7% during 2025 to 64,793 MW, with micro and mini distributed PV accounting for 44,742 MW.
For an individual buyer, those market figures are useful context, but they do not determine whether a specific project will pay back in five, seven or ten years.
That answer comes from the project itself: the tariff, load curve, solar resource, system cost, inverter design, storage strategy and operating risk.
Ultimately, the solar payback period depends less on how many panels are installed than on how much financially valuable electricity the system delivers over time.
The cheapest quotation will not always produce the best payback. A better-designed system controls installed cost while continuing to convert available solar energy into electricity the customer can actually use or sell.
✉️Email: marketing@snadi.com.cn
Website:
☎️WhatsApp / WeChat: +86 1803929353

FAQ
The main factors are net installation cost, annual solar production, electricity tariffs, self-consumption rate, export compensation, financing costs, maintenance, and system downtime. Sites with high daytime electricity use and expensive grid power often achieve stronger savings because more solar energy directly replaces higher-cost electricity.
2. How can businesses shorten the payback period of a solar system?
3. Does inverter performance affect solar panel payback?
4. Does adding battery storage shorten solar payback?
5. Is solar payback period enough to evaluate a commercial solar investment?